OPEN-SOURCE SCRIPT
更新済 Monthly Weekly Daily Hourly CLOSES
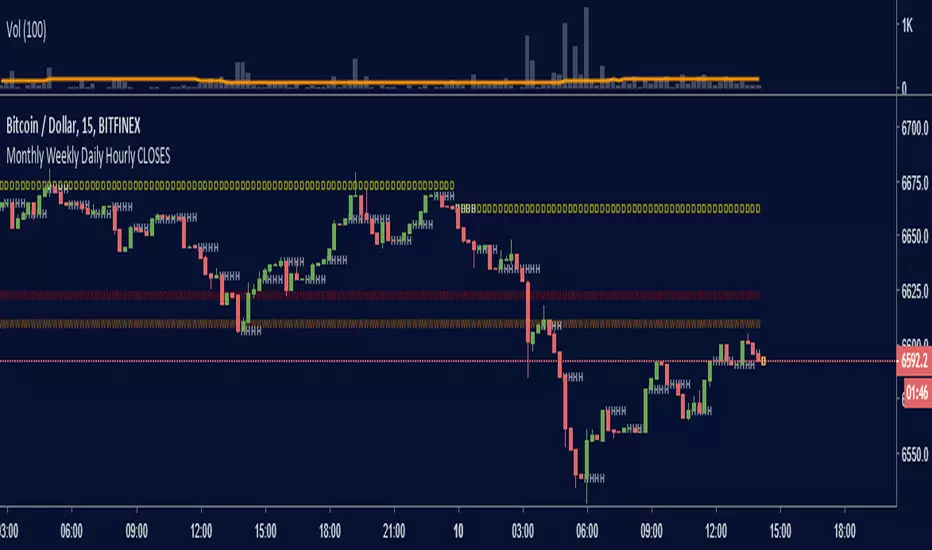
Draws horizontal segments where the last Monthly, Weekly, Daily and Hourly closes are.
Easily identify current price relative position to these key prices.
I use it as a kind of pivot points and help me with trend following entries: longs if up from last close, shorts if down from last close.
Monthly: red line (MMMMM)
Weekly: orange line (WWWWW)
Daily: yellow line (DDDDD)
Hourly: white line (HHHHH)
//Original idea from "Key Levels [treypeng]
リリースノート
Added high / low for each periodAdjusted colors and character for visibility
オープンソーススクリプト
TradingViewの精神に則り、このスクリプトの作者はコードをオープンソースとして公開してくれました。トレーダーが内容を確認・検証できるようにという配慮です。作者に拍手を送りましょう!無料で利用できますが、コードの再公開はハウスルールに従う必要があります。
免責事項
この情報および投稿は、TradingViewが提供または推奨する金融、投資、トレード、その他のアドバイスや推奨を意図するものではなく、それらを構成するものでもありません。詳細は利用規約をご覧ください。
オープンソーススクリプト
TradingViewの精神に則り、このスクリプトの作者はコードをオープンソースとして公開してくれました。トレーダーが内容を確認・検証できるようにという配慮です。作者に拍手を送りましょう!無料で利用できますが、コードの再公開はハウスルールに従う必要があります。
免責事項
この情報および投稿は、TradingViewが提供または推奨する金融、投資、トレード、その他のアドバイスや推奨を意図するものではなく、それらを構成するものでもありません。詳細は利用規約をご覧ください。