PROTECTED SOURCE SCRIPT
更新済 Medium-Term Valuation | MiesOnCharts
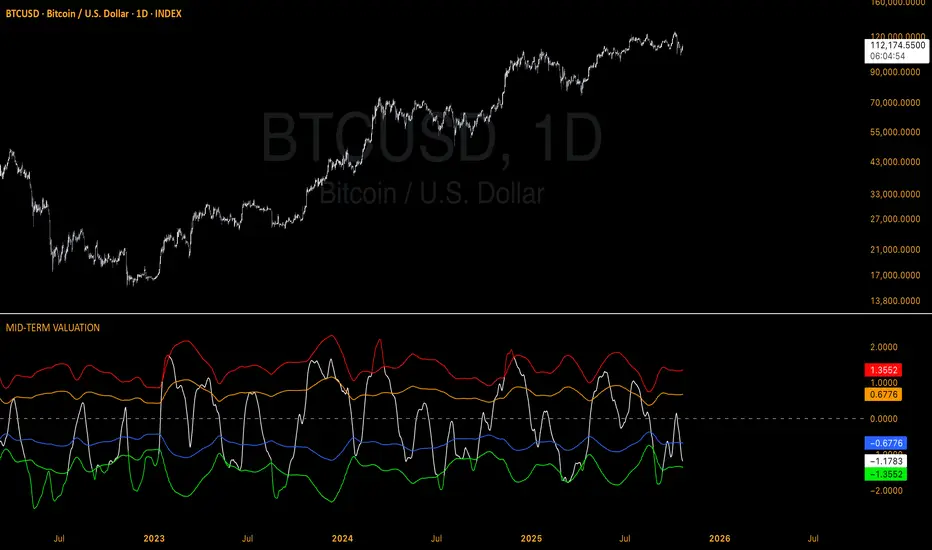
This medium-term valuation indicator integrates multiple valuation metrics to assist investors in identifying oversold and overbought market conditions with greater precision.
How to Interpret:
The indicator employs adaptive standard deviation bands to define extreme market zones. The red band signals a strongly overbought condition, while the green band indicates a significantly oversold condition.
How to Apply:
Investors can leverage these extreme levels as strategic points for taking profits or implementing dollar-cost averaging (DCA) strategies, optimizing entry and exit decisions in the market.
Disclaimer: NOT Financial advice. Past performance is not indicative of future results. No trading strategy can guarantee success in financial markets.
リリースノート
/保護スクリプト
このスクリプトのソースコードは非公開で投稿されています。 しかし、無料かつ制限なしでご利用いただけます ― 詳細についてはこちらをご覧ください。
免責事項
これらの情報および投稿は、TradingViewが提供または保証する金融、投資、取引、またはその他の種類のアドバイスや推奨を意図したものではなく、またそのようなものでもありません。詳しくは利用規約をご覧ください。
保護スクリプト
このスクリプトのソースコードは非公開で投稿されています。 しかし、無料かつ制限なしでご利用いただけます ― 詳細についてはこちらをご覧ください。
免責事項
これらの情報および投稿は、TradingViewが提供または保証する金融、投資、取引、またはその他の種類のアドバイスや推奨を意図したものではなく、またそのようなものでもありません。詳しくは利用規約をご覧ください。