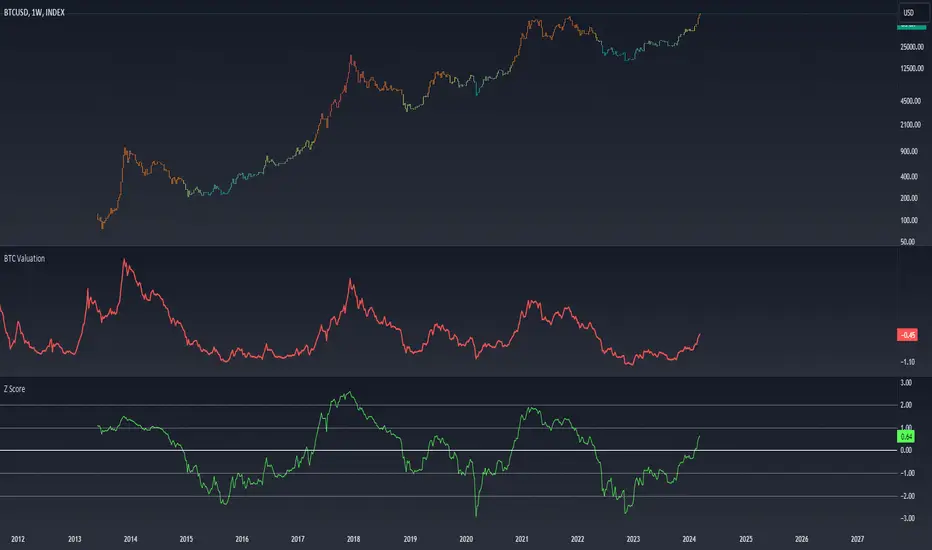
Sharpe Ratio Z-ScoreThis indicator calculates the Sharpe Ratio and its Z-Score , which are used to evaluate the risk-adjusted return of an asset over a given period. The Sharpe Ratio is computed using the average return and the standard deviation of returns, while the Z-Score standardizes this ratio to assess how far the current Sharpe Ratio deviates from its historical average.
The Sharpe Ratio is a measure of how much return an investment has generated relative to the risk it has taken. In the context of this script, the risk-free rate is assumed to be 0, but in real applications, it would typically be the return on a safe investment, like a Treasury bond. A higher Sharpe Ratio indicates that the investment's returns are higher compared to its risk, making it a more favorable investment. Conversely, a lower Sharpe Ratio suggests that the investment may not be worth the risk.
Calculation:
Daily Returns Calculation: The script calculates the daily return of the asset. This measures the percentage change in the asset’s closing price from one period to the next.
Sharpe Ratio Calculation: The Sharpe Ratio is calculated by taking the average daily return and dividing it by the standard deviation of the returns, then multiplying by the square root of the period length.
Usage:
Traders and Investors can use the Sharpe Ratio to evaluate how well the asset is compensating for risk. A high Sharpe Ratio indicates a high return per unit of risk, whereas a low or negative Sharpe Ratio suggests poor risk-adjusted returns. In overbought times, an asset would have high/positive returns per unit of risk. In oversold times, an asset would have low/negative returns per unit of risk.
The Z-Score provides a way to compare the current Sharpe Ratio to its historical distribution, offering a more standardized view of how extreme or typical the current ratio is.
Positive Z-score: Indicates that the asset's return is significantly lower than its risk, suggesting potential oversold conditions.
Negative Z-score: Indicates that the asset's return is significantly higher than its risk, suggesting potential overbought conditions.
Red Zone (-3 to -2): Strong overbought conditions.
Green Zone (2 to 3): Strong oversold conditions.
Sharpe Ratio Limitations:
While the Sharpe Ratio is widely used to evaluate risk-adjusted returns, it has its limitations.
Fat Tails: It assumes that returns are normally distributed and does not account for extreme events or "fat tails" in the return distribution. This can be problematic for assets like cryptocurrencies, which may experience large, sudden price swings that skew the return distribution.
Single Risk Factor: The Sharpe Ratio only considers standard deviation (total volatility) as a measure of risk, ignoring other types of risks like skewness or kurtosis, which may also impact an asset’s performance.
Time Frame Sensitivity: The accuracy of the Sharpe Ratio and its Z-Score is heavily influenced by the time frame chosen for the calculation. A longer period may smooth out short-term fluctuations, while a shorter period might be more sensitive to recent volatility.
Overbought and Oversold Zones: The script marks overbought and oversold conditions based on the Z-Score, but this is not a guarantee of market reversal. It’s important to combine this tool with other technical indicators and fundamental analysis for a more comprehensive market evaluation.
Volatility: The Sharpe Ratio and Z-Score depend on the volatility (standard deviation) of the asset’s returns. For highly volatile assets, such as cryptocurrencies, the Sharpe Ratio may not fully capture the true risk or may be misleading if the volatility is transient.
Doesn't Account for Downside Risk: The Sharpe Ratio treats upside and downside volatility equally, which may not reflect how investors perceive risk. Some investors may be more concerned with downside risk, which the Sharpe Ratio does not distinguish from upside fluctuations.
Important Considerations:
The Sharpe Ratio should not be used in isolation. While it provides valuable insights into risk-adjusted returns, it is important to combine it with other performance and risk indicators to form a more comprehensive market evaluation. Relying solely on the Sharpe Ratio may lead to misleading conclusions, particularly in volatile or non-normally distributed markets.
When integrated into a broader investment strategy, the Sharpe Ratio can help traders and investors better assess the risk-return profile of an asset, identifying periods of potential overperformance or underperformance. However, it should be used alongside other tools to ensure more informed decision-making, especially in highly fluctuating markets.
Valuation

Revenue GridDescription:
The Revenue Grid indicator helps traders and investors visualize a stock’s valuation by plotting horizontal lines based on its price-to-sales (P/S) ratio. This tool displays how the stock price compares to multiples of its total revenue per share, giving a clear perspective on valuation benchmarks.
Fundamental Concept:
The price-to-sales ratio compares a company’s stock price to its revenue per share. It’s used to evaluate whether a stock is overvalued or undervalued based on its revenue.
This indicator offers a unique way to view this ratio by applying Fibonacci multiples to the revenue per share. It plots lines at these multiples to show how the stock price measures up against different valuation levels.
How It Works:
Data Inputs:
Total Revenue (TR): The company’s revenue over the past twelve months.
Total Shares Outstanding (TSO): The total number of shares in circulation.
Calculation:
Calculates the revenue per share (TR/TSO).
Plots lines at fixed Fibonacci multiples (e.g., 1x, 2x, 3x, 5x, 8x, 13x) of the revenue per share value.
How to Use:
1. Add the "Revenue Grid" indicator to your chart by searching for it in the indicator library and applying it.
2. Observe the lines plotted on the chart. If these lines are trending upwards, it indicates that the revenue is increasing.
3. Analyze how historical prices trend relative to these lines. Look for periods where the stock price supports around specific multiples, you can easily get a sense of overvaluation or undervaluation in certain periods.
Use this information to guide further analysis and investment decisions.
Benefits:
1. Clear Valuation View: Easily see how the company’s revenue translates into stock price levels.
2. Investment Insight: Identify if the stock price is lagging behind revenue growth, which might signal a buying opportunity.
3. Historical Context: Understand how the market has historically valued the company and assess the current valuation.
Do let me know your feedbacks in comments. Happy Investing :)

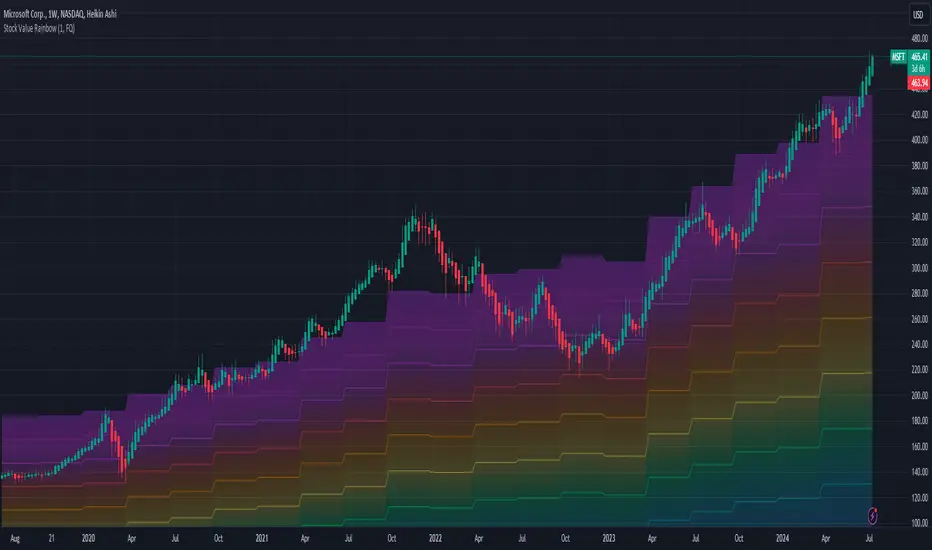
Stock Value RainbowStock Valuation based on Book Value, Dividends, Cashflow, Earnings and Estimates and Money Multiplier
There are many ways to measure stock valuations: some methods are using book value, some are using dividends, some are using cashflow, some are using earnings and some using estimates data. Most of these valuation methods are based on multiplier effect which measure how many times the stock price could expand from their valuation base. This indicator attempts to unify all these measurements using just simple addition of all measurements such as: book value per share, dividend per share, cashflow per share, earning per share, and estimates of earning per share and then using multiplier effect to create beautiful rainbow to see how far the stock has growing up above or below their valuation base. The higher the stock price on rainbow spectrum means it is more expensive and the lower in the rainbow spectrum means it is cheaper. Here is the basic formula explanation:
SV = (BVPS + DPS + CFPS + EPS + EST) * MM
BVPS = Book Value Per Share (Asset - Liability)
DPS = Dividends Per Share
CFPS = Free Cash Flow Per Share
EPS = Earnings Per Share
EST = Estimates of EPS
MM = Money Multiplier (1x, 2x, ... ,10x)
- The gray line represents the stock value SV
- The rainbow above the gray line represents the multiplication factors from 1x, 2x, ..., 10x
- The rainbow below the gray line represents the division factors from 0.8x, 0.6x, ..., 0.2x
Check other script to value stock and index:
- Stock Value Rainbow: script to value stock based on book value, dividend, cash flow, earning and estimates.
- Index Value Rainbow: script to value index based on fed balance sheet and base money supply
- Gold Value Rainbow: script to value gold based on global money supply
- Stock Value US: script to check US stock value
- Stock Value EU: script to check EU stock value
- Stock Value JP: script to check JP stock value
- Stock Value CN: script to check CN stock value
Market Cap / Revenue RatioA variation of the P/S ratio, this script takes the future estimated revenue of the current stock versus it's Market Cap. It then compares the aforementioned Market Cap:Revenue ratio against a market bellwether's corresponding ratio (MSFT by default) to determine the following:
- Light green when the ratio is extremely low (Stock is very undervalued)
- Green when the ratio is low (Stock's multiple is lower by 20-50%)
- Blue when the ratio is close to the benchmark (Stock is fairly valued to benchmark multiple)
- Red when the ratio is high (Stock's mulitple is higher by 50% or more)
- Dark red when the ratio is extremely high (Stock is very overvalued)
CONFIGURABLE
- Full Table: Show the entire calculation table
- Minimalist: Go minimal and show only the ratio and color code
- Show Benchmark Multiple: Show the multiple ratio calculated between the current stock and the benchmark stock (MSFT by default)
NOTES
- When calculating the Market Cap, TradingView sometimes under-reports the number of shares and thus skews the Market Cap too low. This seems to happen for stocks with multiple share classes like GOOGL so be mindful that the data can be wrong for these kinds of stocks. You can check on this by going into the Indicator's Settings and select Show Full Table which will show the number of shares outstanding reported by TradingView.
- For certain stocks such as foreign ADRs, there won't be a future revenue estimate so the script will automatically use the Total Revenue for the most recent Quarter in these cases

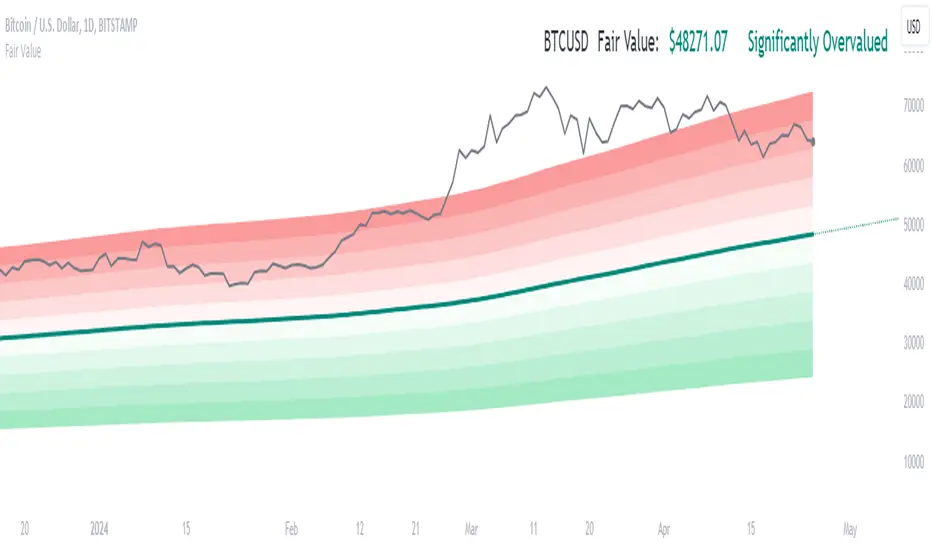
Fair ValueThis indicator is designed to provide a valuation perspective based on a specified length and deviations from a base value. This code calculates fair value levels relative to a chosen source (typically closing prices) using simple moving averages (SMA) or exponential moving averages (EMA). Please note that this is purely educational and should not be considered financial advice.
Key Features:
1. Valuation Calculation: The indicator computes a base value using either SMA or EMA, providing a reference point for fair value.
2. Deviation Levels: Additional levels of valuation are defined as deviations from the base value, indicating potential overvalued or undervalued conditions.
3. Currency-Specific Display: It displays valuation levels in different currency symbols based on the asset's trading currency.
4. Visual Representation: The indicator plots fair value lines and shades areas to highlight potential deviations.
5. Line Projection: A projection line shows potential future movement based on the calculated slope. This feature forecasts future price movement using a linear regression line's slope, dynamically projecting the trend forward. It provides traders with valuable insight into potential future price behavior. The implementation involves complex mathematical computations to determine the slope and iterative drawing of projected segments.
Educational Purpose: This indicator is for educational purposes only. It does not guarantee accuracy or suitability for trading decisions.
Please use caution and consider consulting a financial professional before making any investment decisions based on this indicator. Keep in mind that market conditions can change rapidly, and historical performance may not predict future results.
BTC Valuation
The BTC Valuation indicator
is a powerful tool designed to assist traders and analysts in evaluating the current state of Bitcoin's market valuation. By leveraging key moving averages and a logarithmic trendline, this indicator offers valuable insights into potential buying or selling opportunities based on historical price value.
Key Features:
200MA/P (200-day Moving Average to Price Ratio):
Provides a perspective on Bitcoin's long-term trend by comparing the current price to its 200-day Simple Moving Average (SMA).
A positive value suggests potential undervaluation, while a negative value may indicate overvaluation.
50MA/P (50-day Moving Average to Price Ratio):
Focuses on short-term trends, offering insights into the relationship between Bitcoin's current price and its 50-day SMA.
Helps traders identify potential bullish or bearish trends in the near term.
LTL/P (Logarithmic TrendLine to Price Ratio):
Incorporates a logarithmic trendline, considering Bitcoin's historical age in days.
Assists in evaluating whether the current price aligns with the long-term logarithmic trend, signaling potential overvaluation or undervaluation.
How to Use:
Z Score Indicator Integration:
The BTC Valuation indicator leverages the Z Score Indicator to score the ratios in a statistical way.
Statistical scoring provides a standardized measure of how far each ratio deviates from the mean, aiding in a more nuanced and objective evaluation.
Z Score Indicator
This BTC Valuation indicator provides a comprehensive view of Bitcoin's valuation dynamics, allowing traders to make informed decisions.
While indicators like BTC Valuation provide valuable insights, it's crucial to remember that no indicator guarantees market predictions.
Traders should use indicators as part of a comprehensive strategy and consider multiple factors before making trading decisions.
Historical performance is not indicative of future results. Exercise caution and continually refine your approach based on market dynamics.
EPS GridIntroduction:
This simple indicator offers insights into the relationship between stock prices and earnings, aiding in the assessment of valuation dynamics during different periods.
Understanding Price-to-Earnings (P/E) Ratio:
The commonly used Price to Earnings (P/E) ratio, calculated as Current Price divided by Earnings Per Share (EPS) over the trailing 12 months (TTM), serves as a fundamental metric. Here, we use this formula to estimate a stock's price. For instance, multiplying EPS by 10 provides an approximation of the stock price with a P/E ratio of 10.
The Grid Concept:
Utilizing this principle, a visual grid is constructed to illustrate how stock prices correlate with earnings. This grid facilitates the identification of both potential bargains and overvalued stocks.
How to Utilize:
This indicator is pre-configured with earnings multiples of 10, 15, 20, and 25. Simply add it to your chart and observe whether earnings demonstrate consistent growth. If prices lag behind earnings, a potential catch-up phase may ensue in the future.
Happy Investing!
Embark on your investment journey armed with this indicator, and may it guide you towards informed decisions and successful ventures.

MVRV Z-Score [AlgoAlpha]Introducing the ∑ MVRV Z-Score by AlgoAlpha, a dynamic and sophisticated tool designed for traders seeking to gain an edge in INDEX:BTCUSD analysis. This script employs advanced statistical techniques on Bitcoin On-Chain data to offer a deeper understanding of market conditions, focusing on valuation extremes and momentum trends. Let's explore the features and functionalities that make this tool a valuable addition to your trading arsenal.
Key Features:
🔶 Adjustable Parameters: Customize the Z score lookback length, moving average lookback length, and choose from six moving average types, tailoring the analysis to your trading style.
🔶 Heiken Ashi Compatibility: Incorporate Heiken Ashi plots to visualize market trends, adding a layer of clarity to your technical analysis.
🔶 Divergence Alerts: Detect significant bullish and bearish divergences, allowing for timely identification of potential market reversals.
🔶 Configurable Alerts: Set alerts for overbought, oversold, and divergence conditions, ensuring you never miss an opportunity.
How to Use:
1. ➡️ Parameter Selection: Start by configuring the Z-Score and moving average settings according to your analysis needs. This includes selecting the lookback period and the type of moving average.
2. ➡️ Visualization Options: Choose to enable Heiken Ashi plots for an alternative view of the Z-Score, which can help in identifying trend directions more clearly.
3. ➡️ Monitor for Signals: Keep an eye out for divergence signals and overbought/oversold conditions as potential indicators for entering or exiting trades.
4. ➡️ Alert Setup: Configure alerts based on your selected parameters to receive notifications for important market movements and conditions.
How It Works:
The core of this tool is the Z-Score calculation, which assesses the standard deviation of the current market value from its mean, highlighting overvalued or undervalued market conditions. Here's a brief overview of the script's operational mechanics:
1. 📊 Calculating the Z-Score: The script first calculates the mean over a user-defined lookback period of the MVRV ratio, then it computes the Z-Score to identify deviations from the average.
meanValue = ta.sma(marketValue, zScoreLookback)
zScoreValue = (marketValue - meanValue) / ta.stdev(marketValue, zScoreLookback)
2. 📈 Applying a Moving Average: To smooth the Z-Score data and make trends more discernible, a moving average is applied. Users can choose from several types, such as SMA, EMA, or HMA, based on their preference.
3. 🔄 Heiken Ashi Visualization: For those opting for a more intuitive trend analysis, Heiken Ashi plots can be enabled, transforming the Z-Score data into candlestick charts that simplify trend identification.
4. 🔍 Identifying Divergences: The script is equipped to spot divergences between the market price action and the Z-Score, signaling potential bullish or bearish market reversals.
oscHigherLow = haClose > ta.valuewhen(findPivotLow, haClose , 1) and isInRange(findPivotLow )
priceLowerLow = low < ta.valuewhen(findPivotLow, low , 1)
bullishCondition = enablePlotBullish and priceLowerLow and oscHigherLow and findPivotLow
5. 🚨 Configurable Alerts: Lastly, the script allows for the setting of customizable alerts based on the Z-Score, moving averages, and identified divergences, enabling traders to react promptly to market changes.
The ∑ MVRV Z-Score by AlgoAlpha is an essential tool for traders looking to analyze and interpret market dynamics through a quantitatively rigorous lens. Whether you're focused on identifying market extremes or tracking trend momentum, this script offers the insights needed to support informed trading decisions. 🌟📊💡

Valuation Metrics Table (P/S, P/E, etc.)This table gives the user a very easy way of seeing many valuation metrics. I also included the 5 year median of the price to sales and price to earnings ratios. Then I calculated the percent difference between the median and the current ratio. This gives a sense of whether or not a stock is over valued or under valued based on historical data. The other ratios are well known and don't require any explanation. You can turn off the ones you don't want in the settings of the indicator. Another thing to mention is that diluted EPS is used in calculations

Rolling Risk-Adjusted Performance RatiosThis simple indicator calculates and provides insights into different performance metrics of an asset - Sharpe, Sortino and Omega Ratios in particular. It allows users to customize the lookback period and select their preferred data source for evaluation of an asset.
Sharpe Ratio:
The Sharpe Ratio measures the risk-adjusted return of an asset by considering both the average return and the volatility or riskiness of the investment. A higher Sharpe Ratio indicates better risk-adjusted performance. It allows investors to compare different assets or portfolios and assess whether the returns adequately compensate for the associated risks. A higher Sharpe Ratio implies that the asset generates more return per unit of risk taken.
Sortino Ratio:
The Sortino Ratio is a variation of the Sharpe Ratio that focuses specifically on the downside risk or volatility of an asset. It takes into account only the negative deviations from the average return (downside deviation). By considering downside risk, the Sortino Ratio provides a more refined measure of risk-adjusted performance, particularly for investors who are more concerned with minimizing losses. A higher Sortino Ratio suggests that the asset has superior risk-adjusted returns when considering downside volatility.
Omega Ratio:
The Omega Ratio measures the probability-weighted ratio of gains to losses beyond a certain threshold or target return. It assesses the skewed nature of an asset's returns by differentiating between positive and negative returns and assigning more weight to extreme gains or losses. The Omega Ratio provides insights into the potential asymmetry of returns, highlighting the potential for significant positive or negative outliers. A higher Omega Ratio indicates a higher probability of achieving large positive returns compared to large negative returns.
Utility:
Performance Evaluation: Provides assessment of an asset's performance, considering both returns and risk factors.
Risk Comparison: Allows for comparing the risk-adjusted returns of different assets or portfolios. Helps identify investments with better risk-reward trade-offs.
Risk Management: Assists in managing risk exposure by evaluating downside risks and volatility.

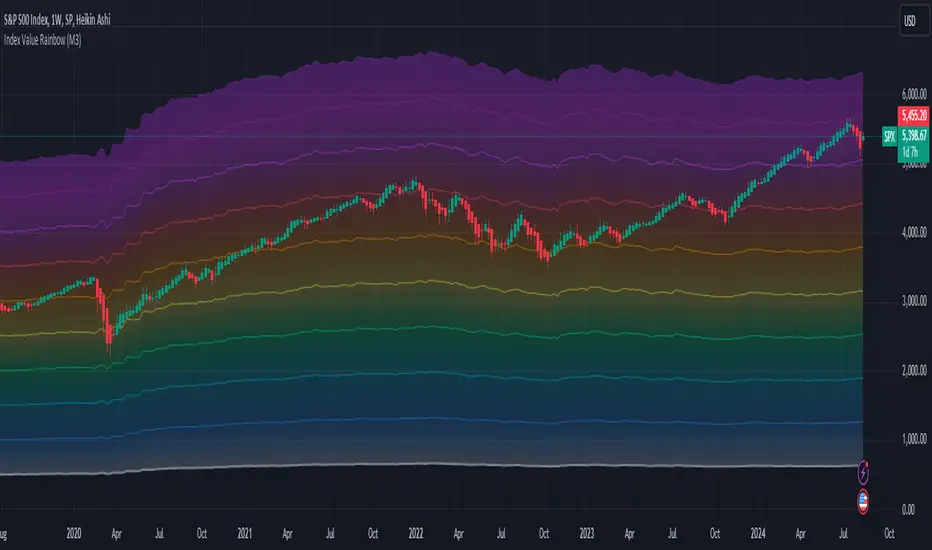
Index Value RainbowThis indicator is used to estimate Index valuation based on each countries base money supply M0. The chart will compare how the index value will move alongside with base money supply for comparison study. The chart presented here is just a relative comparison with some scaling and shifting so it doesn't refers to any real measurement. However it can be used to track the index whether it's too cheap or too expensive in relative to money supply available in the market.
- The gray line represent the money supply M0
- The rainbow above the gray line represent the multiplication factors from 1x, 2x, ..., 10x
- The rainbow below the gray line represent the division factors from 0.8x, 0.6x, ..., 0.2x
This indicator can only be used with specific indices mentioned below. Currently can be used to estimate the value of largest indices by market cap:
- US Index - based on Fed Balance Sheet (SPX, NDX, DJI, RUI, RUT, RUA, ES1!, NQ1!, YM1!, RTY1!)
- EU Index - based on M1 Money Supply (N100, EU500)
- JP Index - based on M0 Money Supply (NI225, NKY)
- CN Index - based on M0 Money Supply (000001, 399001)
- HK Index - based on M0 Money Supply (HSI)
- SG Index - based on M0 Money Supply (STI)
- CA Index - based on M0 Money Supply (TSX)
- AU Index - based on M0 Money Supply (ASX200, AUS200)
- ID Index - based on M0 Money Supply (COMPOSITE)
Check other script to value stock and index:
- Stock Value Rainbow: script to value stock based on book value, earning, dividend and cash flow
- Index Value Rainbow: script to value index based on fed balance sheet and base money supply
- Gold Value Rainbow: script to value gold based on global money supply
- Stock Value US: script to check US stock value
- Stock Value EU: script to check EU stock value
- Stock Value JP: script to check JP stock value
- Stock Value CN: script to check CN stock value
Valuation RainbowValuation Rainbow
© danny_peanuts
Stock value based on Book Value, Earnings, Dividends and Money Multiplier
SV = (BVPS + EPS + DPS) * MM
BVPS = Book Value Per Share
EPS = Earnings Per Share
DPS = Dividends Per Share
MM = Money Multiplier - Integer Number from 1,2,3, ... ,7
There are multiple ways of valuing the stock. Book value is traditionally used as the basic valuation since it's calculate the total asset value minus the liabilities of any company. There are valuation based on multiplication of book value, there are valuation based on multiplication of earnings, and valuation based on multiplication of dividends. Here I'm proposing valuation based on all of these combined. So this indicator is measuring stock value based on multiplication of book value plus earning plus dividend per share. Since the money supply could have an multiplication effect so does the stock value could have a multiplication effect. Also notes that some blue chips stock tends to value higher than startup stock due to money is not equally distributed. So for simplicity I will use simple integer number to represent this multiplication effect as rainbow color plots, thus it can be applied to any stock at any given countries. The higher the stock price on valuation bands the most expensive it is and the lower the price on valuation bands the cheaper it is.

DCF ApproximationThe indicator for calculating and visualizing the Discounted Cash Flow (DCF) for a selected stock.
It uses the Weighted Average Cost of Capital (WACC) with a margin of safety and the Free Cash Flow (FCF) calculation for cash flow analysis. The DCF is calculated by summing the discounted annual FCFs over a 10-year period.
The chart color depends on the value of the current price percentage - it turns red when the market price is over valuation, yellow around a fair value, and green for the price under valuation.
This is an early version of the indicator, so I would appreciate your suggestions for improving the code and formulas.

Capital Asset Pricing Model (CAPM) [Loxx]Capital Asset Pricing Model (CAPM) demonstrates how to calculate the Cost of Equity for an underlying asset using Pine Script. This script will only work on the monthly timeframe. While you can change the default inputs, you should study what CAPM is and how this works before doing so. This indicator pulls various types of data from SPY from various timeframes to calculate risk-free rates, market premiums, and log returns. Alpha and Beta are computed using the regression between underlying asset and SPY. This indicator only calculates on the most recent data. If you wish to change this, you'll have to save the script and make adjustments. A few examples where CAPM is used:
Used as the mu factor Geometric Brownian Motion models for options pricing and forecasting price ranges and decay
Calculating the Weighted Average Cost of Capital
Asset pricing
Efficient frontier
Risk and diversification
Security market line
Discounted Cashflow Analysis
Investment bankers use CAPM to value deals
Account firms use CAPM to verify asset prices and assumptions
Real estate firms use variations of CAPM to value properties
... and more
Details of the calculations used here
Rm is calculated using yearly simple returns data from SPY, typically this is just hard coded as 10%.
Rf is pulled from US 10 year bond yields
Beta and Alpha are pulled form monthly returns data of the asset and SPY
In the past, typically this data is purchased from investments banks whose research arms produce values for beta, alpha, risk free rate, and risk premiums. In 2022 ,you can find free estimates for each parameter but these values might not reflect the most current data or research.
History
The CAPM was introduced by Jack Treynor (1961, 1962), William F. Sharpe (1964), John Lintner (1965) and Jan Mossin (1966) independently, building on the earlier work of Harry Markowitz on diversification and modern portfolio theory. Sharpe, Markowitz and Merton Miller jointly received the 1990 Nobel Memorial Prize in Economics for this contribution to the field of financial economics. Fischer Black (1972) developed another version of CAPM, called Black CAPM or zero-beta CAPM, that does not assume the existence of a riskless asset. This version was more robust against empirical testing and was influential in the widespread adoption of the CAPM.
Usage
The CAPM is used to calculate the amount of return that investors need to realize to compensate for a particular level of risk. It subtracts the risk-free rate from the expected rate and weighs it with a factor – beta – to get the risk premium. It then adds the risk premium to the risk-free rate of return to get the rate of return an investor expects as compensation for the risk. The CAPM formula is expressed as follows:
r = Rf + beta (Rm – Rf) + Alpha
Therefore,
Alpha = R – Rf – beta (Rm-Rf)
Where:
R represents the portfolio return
Rf represents the risk-free rate of return
Beta represents the systematic risk of a portfolio
Rm represents the market return, per a benchmark
For example, assuming that the actual return of the fund is 30, the risk-free rate is 8%, beta is 1.1, and the benchmark index return is 20%, alpha is calculated as:
Alpha = (0.30-0.08) – 1.1 (0.20-0.08) = 0.088 or 8.8%
The result shows that the investment in this example outperformed the benchmark index by 8.8%.
The alpha of a portfolio is the excess return it produces compared to a benchmark index. Investors in mutual funds or ETFs often look for a fund with a high alpha in hopes of getting a superior return on investment (ROI).
The alpha ratio is often used along with the beta coefficient, which is a measure of the volatility of an investment. The two ratios are both used in the Capital Assets Pricing Model (CAPM) to analyze a portfolio of investments and assess its theoretical performance.
To see CAPM in action in terms of calculate WACC, see here for an example: finbox.com
Further reading
en.wikipedia.org

Market Beta/Beta Coefficient for CAPM [Loxx]Market Beta/Beta Coefficient for CAPM is not so much an indicator as it is a value to be used in future indicators to forecast stock prices using the Capital Asset Pricing Model, CAPM. CAPM is used by the likes of value investors such as Warren Buffet and valuation/accounting/investment banking firms. More specifically, CAPM is typically used in Discounted Cashflow Analysis to value revenue generating assets.
What is Beta?
In finance, the beta (β or market beta or beta coefficient) is a measure of how an individual asset moves (on average) when the overall stock market increases or decreases. Thus, beta is a useful measure of the contribution of an individual asset to the risk of the market portfolio when it is added in small quantity. Thus, beta is referred to as an asset's non-diversifiable risk, its systematic risk, market risk, or hedge ratio. Beta is not a measure of idiosyncratic risk.
By definition, the value-weighted average of all market-betas of all investable assets with respect to the value-weighted market index is 1. If an asset has a beta above (below) 1, it indicates that its return moves more (less) than 1-to-1 with the return of the market-portfolio, on average. In practice, few stocks have negative betas (tending to go up when the market goes down). Most stocks have betas between 0 and 3.
How to calculate Beta
To calculate beta you typically choose 5 years of monthly data; typically SPY is used here
Calculate log returns of both the asset for which you are calculating Beta and the benchmark market data
Calculation the covariance between the asset and benchmark
Calculate the variance of the benchmark returns
Divide the covariance by the variance
Read more here:
en.wikipedia.org(finance)
en.wikipedia.org
einvestingforbeginners.com

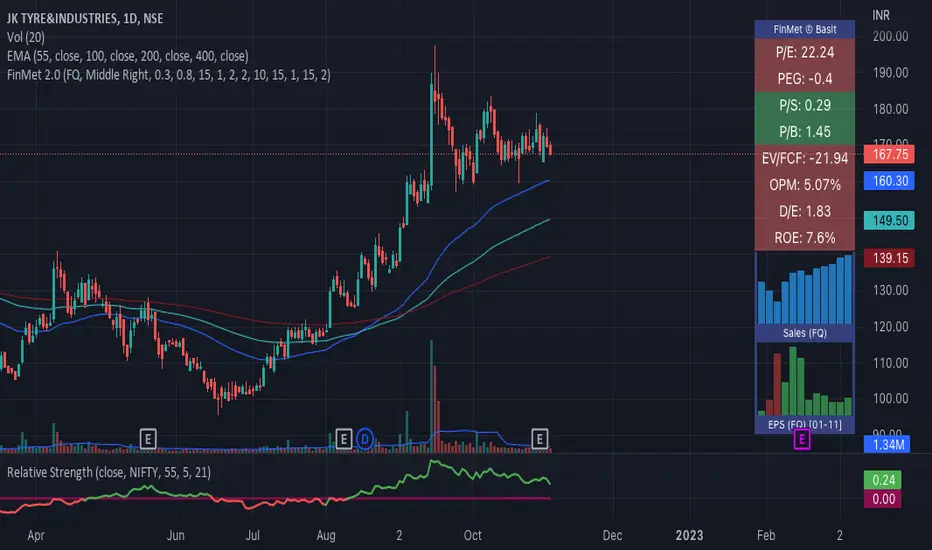
Financial MetricsGives a sneak peak into some of the important financial ratios described below:
1. P/E : price to earnings ratio (Green when P/E<15)
2. PEG: Price to earnings growth ratio (Green when PEG<1)
3. P/S: Price to sales ratio (Green when P/S<2)
4. EV/FCF: Enterprise Value to Free Cashflow ratio
5. OPM: Operating Profit Margin % (Green when OPM>15%)
6. D/E: Debt to equity ratio (Green when D/E<1)
7. ROE: Return on equity % (Green when ROE>15%)
8. Div_Yield: Dividend yield
Disclaimer: All the limits defined are based on the widely accepted general values, but are subjective to particular sector or group of stocks. For example IT stocks command higher valuation than cyclical stocks like metal. So Compare with other stocks of the same sector to reach any conclusion.
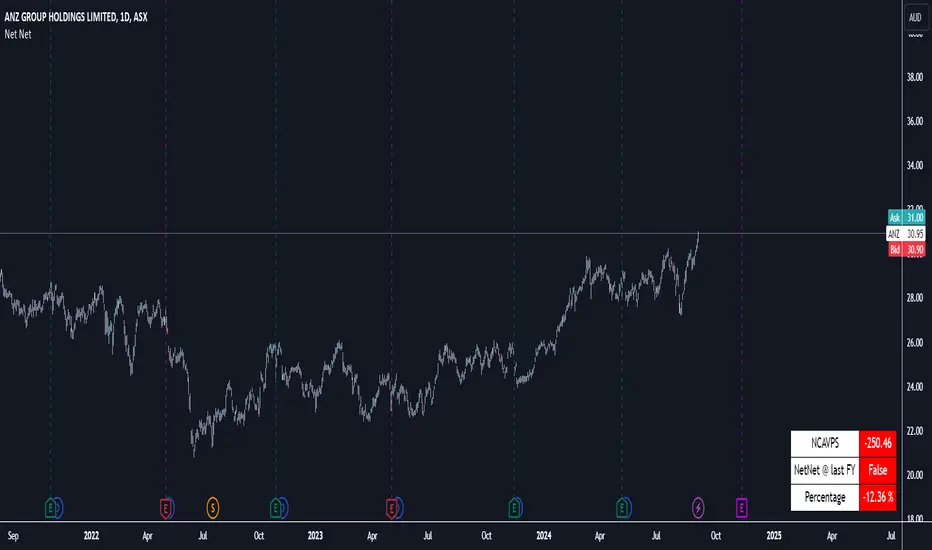
Benjamin Graham Net-Net AnalyserA simple indicator that displayers as a table, telling you whether or not the stock you have selected has a current price that is less than 67% of the company's net current asset value per share (NCAVPS) at its last reporting period (FQ, FY, TTM).
Benjamin Graham uses this 67% rule to decide whether or not a stock is significantly undervalued, and studies have shown that investing in companies whose share prices are less than 67% of their NCAVPS can be highly profitable, and will beat markets in the long run.
Feel free to use as you please or repurpose the code for your own projects.
EsIstTurnt's Relative Value Comparison Multi SymbolCompare the relative valuation of up to 8 tickers. By taking a shorter term moving average and dividing by a longer term moving average(optionally with an offset) we get a value that is either above or below 1. Easy to tell what is undervalued and overvalued with this setup. Useful for comparing different asset classes or sector specific securities looking for outperformers/underperformers. Overvalued and Undervalued levels marked by Red and Green background. Recommended in conjunction with other indicators of your choosing for confirmation of trend changes but this is good for getting a broader view of the market you're interested in. Multiple timeframes, sources available however you should tinker with it to find what gives you the best view for your preferred timeframe.

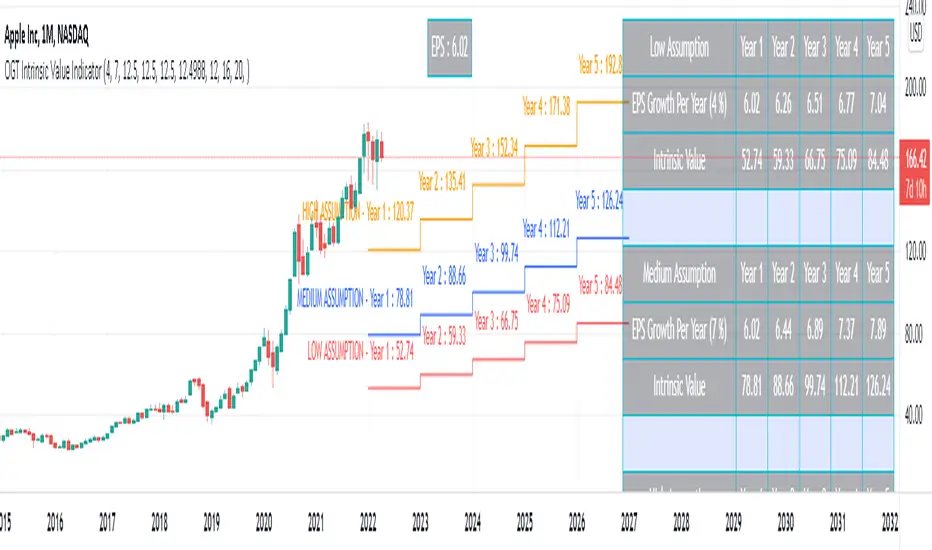
OGT Intrinsic Value IndicatorOGT Intrinsic Value Indicator
This indicator will show you visually the intrinsic value of a stock. Intrinsic value aims to measure of what an asset is worth. There are a number of intrinsic valuation models where this TradingView indicator uses an earnings valuation model.
There are 4 inputs to the model:
1) EPS trailing 12 months (ttm) - the first step is to know what the current EPS is for a stock. The indicator calculates this for you
2) Annual EPS Growth Next 5 Years - You need to input what you think the annual growth rate is going to be for the stock. You can use you annual estimates which you can obtain by searching "stock name - eps growth forecast"
3) Earnings Multiple (PE Ratio) - The next step is to input the earnings multiple in year 5. You can get this from analyst estimates or looking at the average PE ratio of the asset over the past 3 / 5 / 10 years.
4) Desired Rate Of Return - The last input is your rate of return. I personally use 12.5% as you can invest in an S&P ETF and get 8-10% return. So I prefer a higher rate of return for the risk I am taking.
You will need to input your low, medium and high assumptions so you can see the different price ranges.
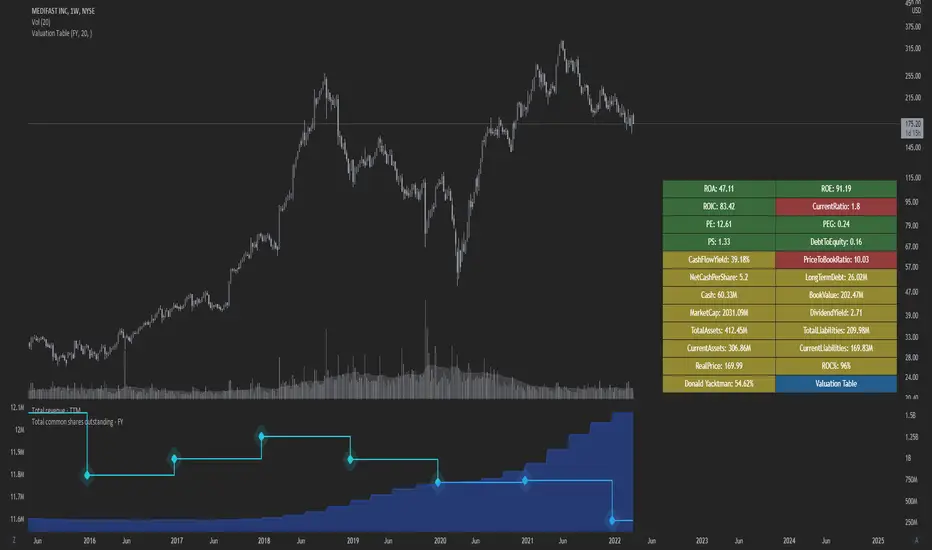
Valuation TableHey folks, I hope you are all doing well!
This is an indicator that you can use to help you to evaluate companies. There are a few things I added to the valuation table that I personally use and I will explain what they are.
I added Joel Greenblatt's ROC% because it takes Earnings before Interest and Taxes to reflect more closely what the company earns from its operations, while including the cost of depreciation/amortization of assets. A high double digit figure often means that the company has a defensible edge versus its competitors (e.g. a strong brand or a unique product). It's good for relative valuation (comparing two companies in the same industry).
I also added Donald Yacktman's forward rate of return. Yacktman defines forward rate of return as the normalized free cash flow yield plus real growth plus inflation . Unlike the Earnings Yield %, the Forward Rate of Return uses the normalized Free Cash Flow of the past seven years, and considers growth. The forward rate of return can be thought of as the return that investors buying the stock today can expect from it in the future. Yacktman’s Forward Rate of Return may or may not be a useful metric. However, it does present new ways to see and think about stocks we may want to buy.
I added a box called "real price" and that is from Peter Lynch's book, "One Up on Wall Street," where he talked about how the real price of the stock is really the current price - Net Cash Per Share.
I would also personally pair this script with TradingView's built in financial indicators that shows the revenue growth, net income, etc.
Note: the script only works on the weekly timeframe and it will take some time to load because it has a lot of data.
FunctionBlackScholesLibrary "FunctionBlackScholes"
Some methods for the Black Scholes Options Model, which demonstrates several approaches to the valuation of a European call.
// reference:
// people.math.sc.edu
// people.math.sc.edu
asset_path(s0, mu, sigma, t1, n) Simulates the behavior of an asset price over time.
Parameters:
s0 : float, asset price at time 0.
mu : float, growth rate.
sigma : float, volatility.
t1 : float, time to expiry date.
n : int, time steps to expiry date.
Returns: option values at each equal timed step (0 -> t1)
binomial(s0, e, r, sigma, t1, m) Uses the binomial method for a European call.
Parameters:
s0 : float, asset price at time 0.
e : float, exercise price.
r : float, interest rate.
sigma : float, volatility.
t1 : float, time to expiry date.
m : int, time steps to expiry date.
Returns: option value at time 0.
bsf(s0, t0, e, r, sigma, t1) Evaluates the Black-Scholes formula for a European call.
Parameters:
s0 : float, asset price at time 0.
t0 : float, time at which the price is known.
e : float, exercise price.
r : float, interest rate.
sigma : float, volatility.
t1 : float, time to expiry date.
Returns: option value at time 0.
forward(e, r, sigma, t1, nx, nt, smax) Forward difference method to value a European call option.
Parameters:
e : float, exercise price.
r : float, interest rate.
sigma : float, volatility.
t1 : float, time to expiry date.
nx : int, number of space steps in interval (0, L).
nt : int, number of time steps.
smax : float, maximum value of S to consider.
Returns: option values for the european call, float array of size ((nx-1) * (nt+1)).
mc(s0, e, r, sigma, t1, m) Uses Monte Carlo valuation on a European call.
Parameters:
s0 : float, asset price at time 0.
e : float, exercise price.
r : float, interest rate.
sigma : float, volatility.
t1 : float, time to expiry date.
m : int, time steps to expiry date.
Returns: confidence interval for the estimated range of valuation.

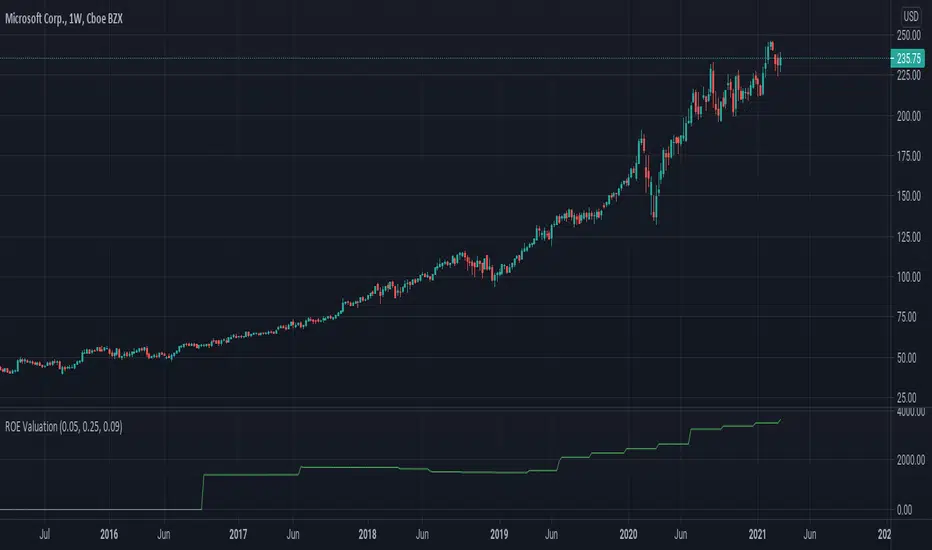
ROE ValuationAn indicator that can be used to study ROE Valuation for stocks.
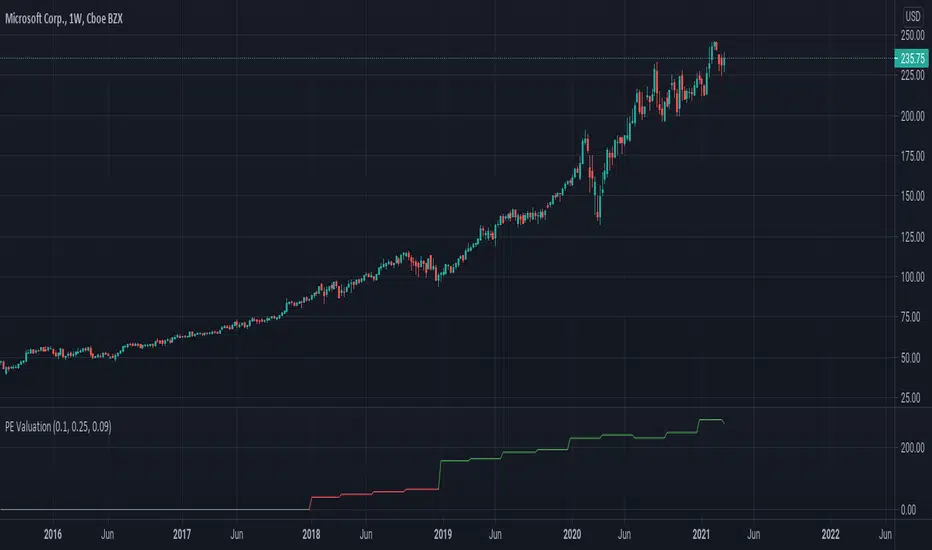
Red color means the market price is higher than the valuation whereas green color means the market price is below the valuation and it might be a good opportunity for value traders. Gray color indicates non-applicable results, when valuation is below zero for example.
PE ValuationAn indicator that can be used to study PE Valuation for stocks.
When the reported EPS for a company is non-positive the line turns gray. Red color means the market price is higher than the valuation whereas green color means the market price is below the valuation and it might be a good opportunity for value traders.