PROTECTED SOURCE SCRIPT
Global Market Signals: EMA ROC
Welcome!
Thanks for checking out my indicator.
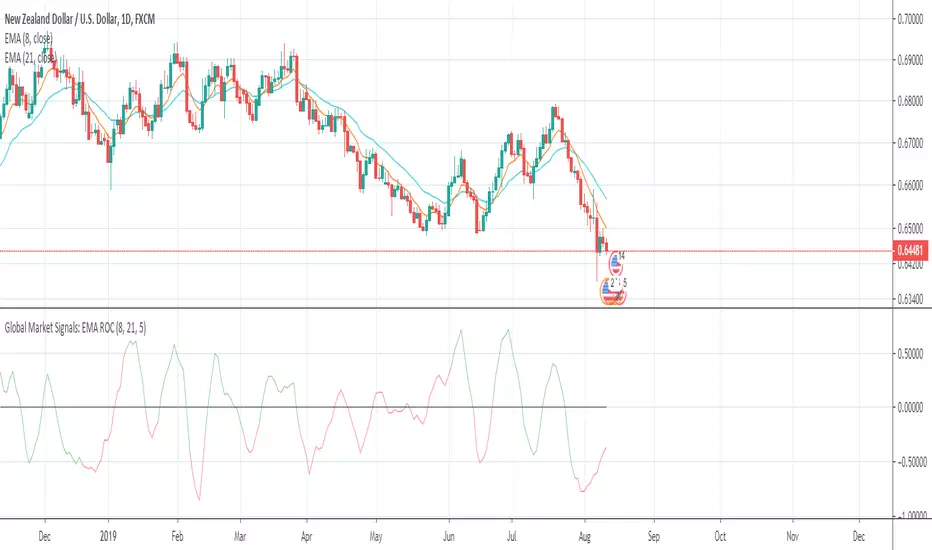
This is the difference in the rate of change between two exponential moving averages.
The colors are green and red:
- Green is when the fast EMA > slow EMA
- Red is when the fast EMA < slow EMA
When the indicator approaches it's upper or lower limits, it will indicate either sideways price movement or a reversal. When the color changes around it's upper or lower limits from green to red or vice-versa, an EMA crossover just occurred and a continuation of trend is possible before a pause or reversal in price.
I hope this helps!
Andre
Global Market Signals
Thanks for checking out my indicator.
This is the difference in the rate of change between two exponential moving averages.
The colors are green and red:
- Green is when the fast EMA > slow EMA
- Red is when the fast EMA < slow EMA
When the indicator approaches it's upper or lower limits, it will indicate either sideways price movement or a reversal. When the color changes around it's upper or lower limits from green to red or vice-versa, an EMA crossover just occurred and a continuation of trend is possible before a pause or reversal in price.
I hope this helps!
Andre
Global Market Signals
保護スクリプト
このスクリプトのソースコードは非公開で投稿されています。 ただし、制限なく自由に使用できます – 詳細はこちらでご確認ください。
免責事項
この情報および投稿は、TradingViewが提供または推奨する金融、投資、トレード、その他のアドバイスや推奨を意図するものではなく、それらを構成するものでもありません。詳細は利用規約をご覧ください。
保護スクリプト
このスクリプトのソースコードは非公開で投稿されています。 ただし、制限なく自由に使用できます – 詳細はこちらでご確認ください。
免責事項
この情報および投稿は、TradingViewが提供または推奨する金融、投資、トレード、その他のアドバイスや推奨を意図するものではなく、それらを構成するものでもありません。詳細は利用規約をご覧ください。