OPEN-SOURCE SCRIPT
更新済 Volume as a Percent of Float by 3iau
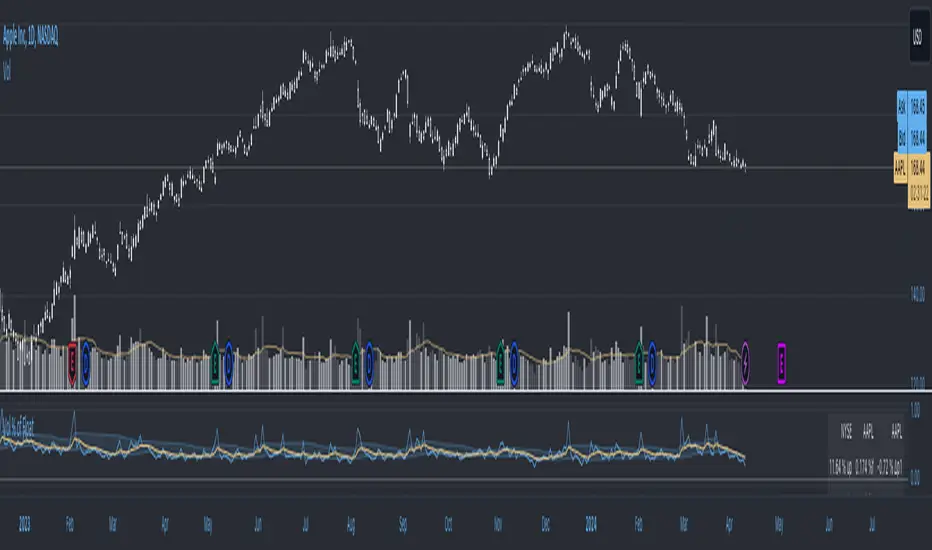
Volume as a Percent of Float
- Plot the difference between current Chart Volume as a percent of Float/Outstanding and the moving average of the same.
- Apply a multiplier to this value.
- Plot the moving average of the difference between current Chart Volume as a percent of Float/Outstanding and the moving average of the same.
リリースノート
Added plot for columns, line, and areaリリースノート
fixed errorsリリースノート
Changed defaultsリリースノート
added display optionsリリースノート
Edited section headingsリリースノート
Edited defaultsリリースノート
added a table to report the current volume as a percent of floatリリースノート
edited tableリリースノート
added color scheme for up and down period columns and selection to define up or down as current period close - previous period close or current period close vs current period open.リリースノート
Added exchange upside/downside data to tableリリースノート
added info to the table: float to outstanding ratio, and change in price at up to 5 periods.リリースノート
fixed an error in the tableリリースノート
edited table display optionsリリースノート
edited the table percent change column to automatically sort the inputs in ascending order and eliminate duplicate inputsリリースノート
edited script notesリリースノート
Fix and script errorリリースノート
Added the tick index (nyse, nasdaq, djia) to the table dataリリースノート
Edited the way the table sorts selectionsリリースノート
Edited table data: changed USI:TICK timeframe period as it was not reporting realtime TICK when chart timeframe was 1D.リリースノート
Added option for breadth data displayed in table. Now, may select Tick or Trin to be displayed.リリースノート
changed settings descriptions, added tooltipsリリースノート
Corrected an error in the code.オープンソーススクリプト
TradingViewの精神に則り、このスクリプトの作者はコードをオープンソースとして公開してくれました。トレーダーが内容を確認・検証できるようにという配慮です。作者に拍手を送りましょう!無料で利用できますが、コードの再公開はハウスルールに従う必要があります。
免責事項
この情報および投稿は、TradingViewが提供または推奨する金融、投資、トレード、その他のアドバイスや推奨を意図するものではなく、それらを構成するものでもありません。詳細は利用規約をご覧ください。
オープンソーススクリプト
TradingViewの精神に則り、このスクリプトの作者はコードをオープンソースとして公開してくれました。トレーダーが内容を確認・検証できるようにという配慮です。作者に拍手を送りましょう!無料で利用できますが、コードの再公開はハウスルールに従う必要があります。
免責事項
この情報および投稿は、TradingViewが提供または推奨する金融、投資、トレード、その他のアドバイスや推奨を意図するものではなく、それらを構成するものでもありません。詳細は利用規約をご覧ください。