OPEN-SOURCE SCRIPT
更新済 Multi-Timeframe EMAs
Multi Timeframe EMA's
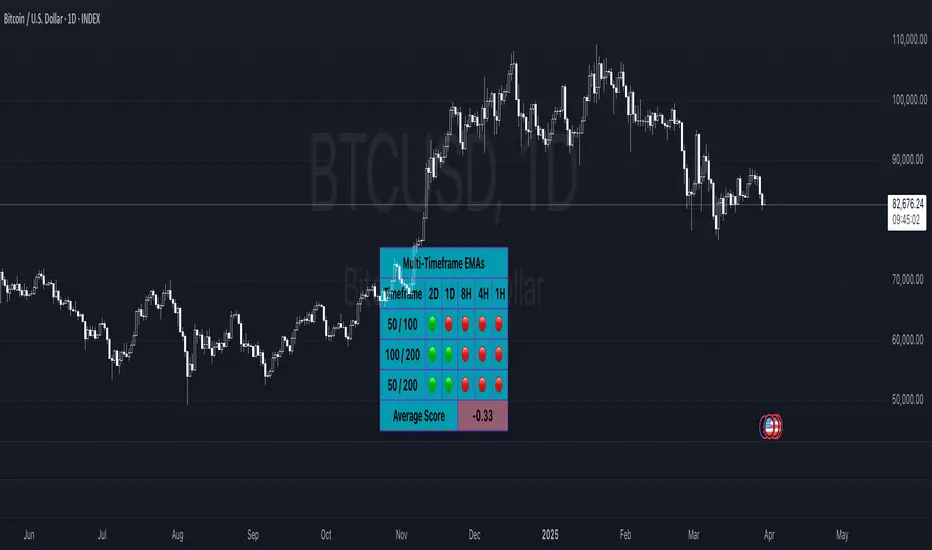
The 'Multi-Timeframe EMA Band Comparison' indicator is a tool designed to analyze trend direction across multiple timeframes using Exponential Moving Averages. it calculates the 50, 100, and 200 period EMAs for fiver user defined timeframes and compares their relationships to provide a visual snapshot of bullish or bearish momentum.
How it Works:
Average Score:
An overall average score is calculated across all 15 comparisons ranging from 1 to -1, displayed with two decimal places and color coded.
Customization:
This indicator is fully customizable from the timeframe setting to the color of the table. The only specific part that is not changeable is the EMA bands.
The 'Multi-Timeframe EMA Band Comparison' indicator is a tool designed to analyze trend direction across multiple timeframes using Exponential Moving Averages. it calculates the 50, 100, and 200 period EMAs for fiver user defined timeframes and compares their relationships to provide a visual snapshot of bullish or bearish momentum.
How it Works:
- EMA Calculations: For each selected timeframe, the indicator computes the 50, 100, and 200 period EMAs based on the closing price.
- Band Comparisons: Three key relationships are evaluated:
- 50 EMA vs 100 EMA
- 100 EMA vs 200 EMA
- 50 EMA vs 200 EMA
- Scoring System: Each comparison is assigned a score:
- 🟢 (Green Circle): The shorter EMA is above the longer EMA, signaling bullish momentum.
- 🔴 (Red Circle): The shorter EMA is below the longer EMA, signaling bearish momentum.
- ⚪️ (White Circle): The EMAs are equal or data is unavailable (rare).
Average Score:
An overall average score is calculated across all 15 comparisons ranging from 1 to -1, displayed with two decimal places and color coded.
Customization:
This indicator is fully customizable from the timeframe setting to the color of the table. The only specific part that is not changeable is the EMA bands.
リリースノート
Dynamic Inputs for the lengths have been added. リリースノート
- Updated boolean to show EMA lengths for selected lengthsオープンソーススクリプト
TradingViewの精神に則り、このスクリプトの作者はコードをオープンソースとして公開してくれました。トレーダーが内容を確認・検証できるようにという配慮です。作者に拍手を送りましょう!無料で利用できますが、コードの再公開はハウスルールに従う必要があります。
免責事項
この情報および投稿は、TradingViewが提供または推奨する金融、投資、トレード、その他のアドバイスや推奨を意図するものではなく、それらを構成するものでもありません。詳細は利用規約をご覧ください。
オープンソーススクリプト
TradingViewの精神に則り、このスクリプトの作者はコードをオープンソースとして公開してくれました。トレーダーが内容を確認・検証できるようにという配慮です。作者に拍手を送りましょう!無料で利用できますが、コードの再公開はハウスルールに従う必要があります。
免責事項
この情報および投稿は、TradingViewが提供または推奨する金融、投資、トレード、その他のアドバイスや推奨を意図するものではなく、それらを構成するものでもありません。詳細は利用規約をご覧ください。