INVITE-ONLY SCRIPT
更新済 RSI Swing v2 [Premium]
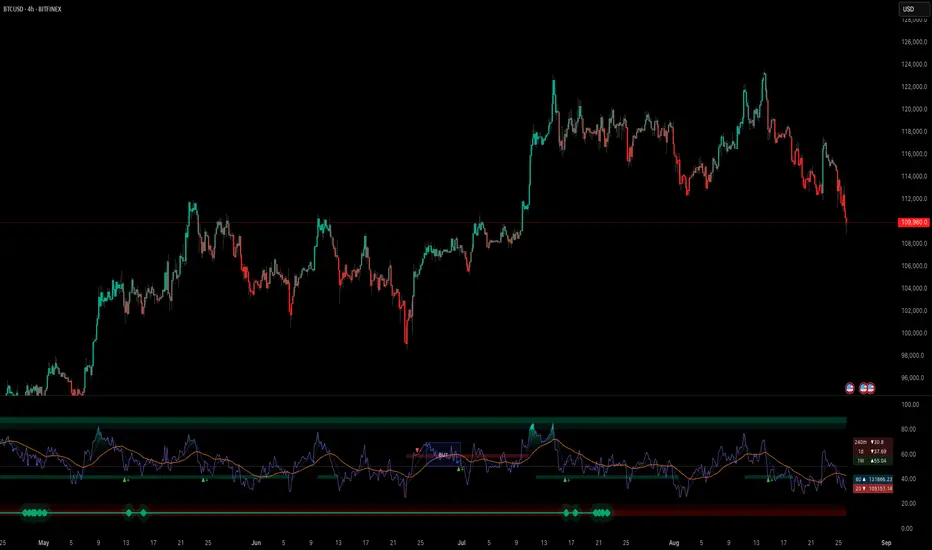
The RSI signal is displayed with different color zones to reflect the value on the chart. This makes field evaluation more efficient.
RSI values of different time frames are displayed in the table, helping to evaluate the market more objectively.
A Retest Buy signal is given when the RSI value decreases from the area of more than 80 to 50.
Retest Sell signal is given when the RSI value increases from less than 20 to 50.
Retest Validation results are highlighted in bold for easy detection.
Settings:
* Length, source RSI
* Text size
* Type + Length MA
* RSI ADVANCE SETTINGS:
- Value RSI Range retest for Long trend
- Value RSI Range retest for Sell trend
This Indicator alert was created for the RSI Retest.
Recommendation: Should be used in combination with other Indicators to observe the market more effectively
リリースノート
Fix bugリリースノート
- Fig bug- Add RSI Cloud
- Add RSI Ichimoku
- Calculator more Signals
リリースノート
- Fix Bugリリースノート
Fix bugリリースノート
- Fix bugリリースノート
- Update Algorithmリリースノート
- Update algorithmリリースノート
Update: - Buy bottom
- Sell top
リリースノート
Fixed bugリリースノート
Updateリリースノート
Updateリリースノート
mrD Oscillator Premium [4.7] Update リリースノート
display improveリリースノート
Code Updatedリリースノート
Added levelsリリースノート
Update 5.0 リリースノート
[5.1] Updateリリースノート
5.2 updateリリースノート
[1.4.5] Updateリリースノート
Fix bugリリースノート
Fixed bugリリースノート
5.4 Update displayリリースノート
5.4.1 Updatedリリースノート
Update codeリリースノート
5.5 updateリリースノート
Fixed small bugリリースノート
Advanced signals updated.Alerts Fixed bugs.
リリースノート
- Update the new algorithm.
- Improve signal
- Smooth chart
招待専用スクリプト
このスクリプトは作者が承認したユーザーのみアクセス可能です。使用するにはアクセス申請をして許可を得る必要があります。通常は支払い後に承認されます。詳細は下記の作者の指示に従うか、mrDocCに直接お問い合わせください。
TradingViewは、作者を完全に信頼し、スクリプトの動作を理解していない限り、有料スクリプトの購入・使用を推奨しません。コミュニティスクリプトには無料のオープンソースの代替が多数あります。
作者の指示
Contact
All scripts are for informational & educational purposes only. Past performance does not guarantee future results.
免責事項
この情報および投稿は、TradingViewが提供または推奨する金融、投資、トレード、その他のアドバイスや推奨を意図するものではなく、それらを構成するものでもありません。詳細は利用規約をご覧ください。