OPEN-SOURCE SCRIPT
Moving Average Channel
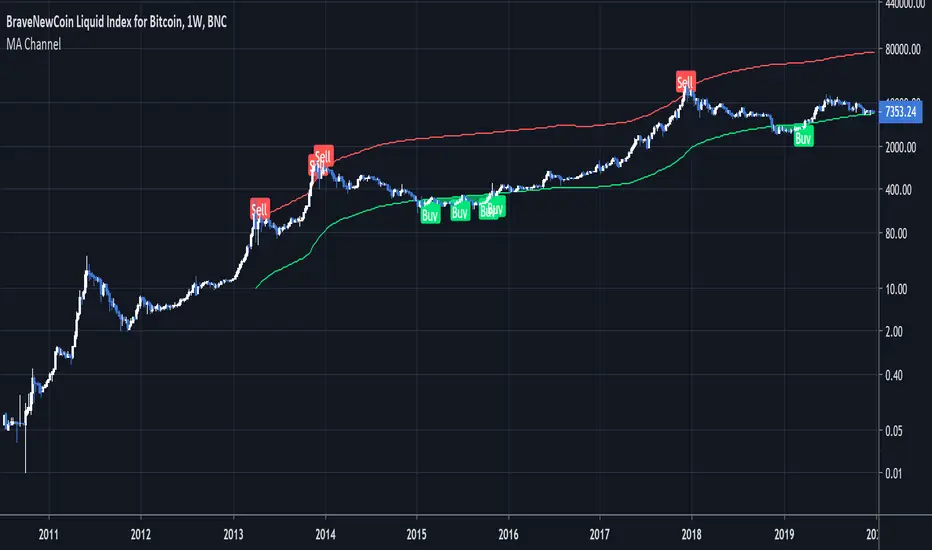
Intended for use on BTC long term (BNC:BLX Weekly) with Logarithmic charts only
As Bitcoin is adopted, it moves through market cycles. These are created by periods where market participants are over-excited causing the price to over-extend, and periods where they are overly pessimistic where the price over-contracts. Identifying and understanding these periods can be beneficial to the long term investor. This long term investment tool is a simple and effective way to highlight those periods.
Buying Bitcoin when the price drops below the green line has historically generated outsized returns. Selling Bitcoin when price goes above the red line has been historically effective for taking profits.
NOTE: 144 Week = 2¾ Years. 104 Weeks = 2 Years. Originally created by Philip Swift
オープンソーススクリプト
TradingViewの精神に則り、このスクリプトの作者はコードをオープンソースとして公開してくれました。トレーダーが内容を確認・検証できるようにという配慮です。作者に拍手を送りましょう!無料で利用できますが、コードの再公開はハウスルールに従う必要があります。
免責事項
この情報および投稿は、TradingViewが提供または推奨する金融、投資、トレード、その他のアドバイスや推奨を意図するものではなく、それらを構成するものでもありません。詳細は利用規約をご覧ください。
オープンソーススクリプト
TradingViewの精神に則り、このスクリプトの作者はコードをオープンソースとして公開してくれました。トレーダーが内容を確認・検証できるようにという配慮です。作者に拍手を送りましょう!無料で利用できますが、コードの再公開はハウスルールに従う必要があります。
免責事項
この情報および投稿は、TradingViewが提供または推奨する金融、投資、トレード、その他のアドバイスや推奨を意図するものではなく、それらを構成するものでもありません。詳細は利用規約をご覧ください。