OPEN-SOURCE SCRIPT
更新済 Foxy's Z-Score

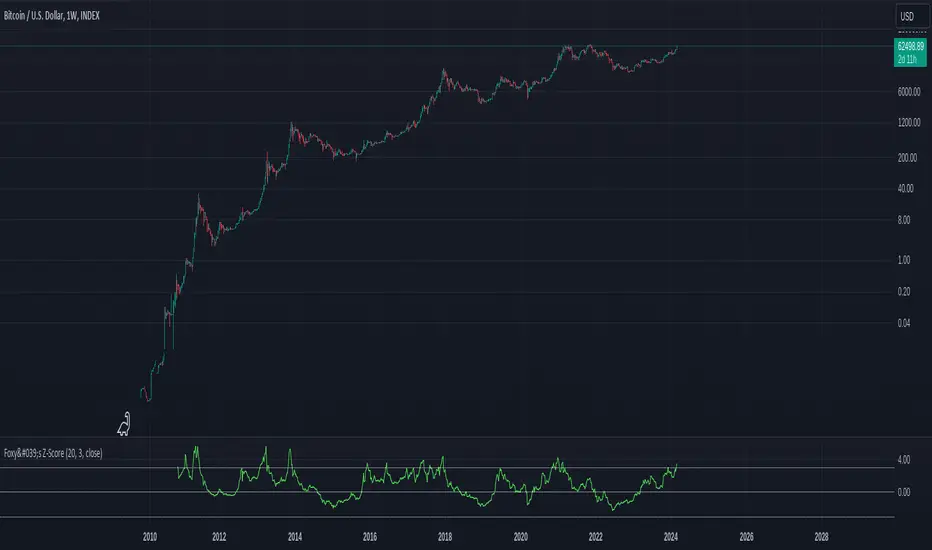
Introducing Foxy's Z-Score Indicator, a powerful tool for identifying potential trend reversals and market anomalies. This indicator calculates the Z-Score of the closing price, which represents the number of standard deviations from the mean, providing valuable insights into the market's behavior.
Key Features:
Auto Length Selection: The script automatically selects the optimal length based on the selected timeframe, ensuring accurate calculations and relevant signals.
Customizable Length and Standard Deviations: Users can manually input their preferred length and standard deviation values, offering flexibility to adapt to various trading strategies and market conditions.
Visual Representation: The indicator plots the Z-Score line along with three horizontal lines representing the standard deviation values, making it easy to identify overbought and oversold conditions.
Multiple Timeframes: The indicator works seamlessly across different timeframes, allowing traders to analyze short-term and long-term trends.
By incorporating Foxy's Z-Score Indicator into your trading toolkit, you can enhance your ability to spot potential market reversals and make more informed trading decisions.
リリースノート
Add Option to Smooth Sourceリリースノート
Add Multiple MA and Fix Default Parametersリリースノート
Add DSMAオープンソーススクリプト
TradingViewの精神に則り、このスクリプトの作者はコードをオープンソースとして公開してくれました。トレーダーが内容を確認・検証できるようにという配慮です。作者に拍手を送りましょう!無料で利用できますが、コードの再公開はハウスルールに従う必要があります。
免責事項
この情報および投稿は、TradingViewが提供または推奨する金融、投資、トレード、その他のアドバイスや推奨を意図するものではなく、それらを構成するものでもありません。詳細は利用規約をご覧ください。
オープンソーススクリプト
TradingViewの精神に則り、このスクリプトの作者はコードをオープンソースとして公開してくれました。トレーダーが内容を確認・検証できるようにという配慮です。作者に拍手を送りましょう!無料で利用できますが、コードの再公開はハウスルールに従う必要があります。
免責事項
この情報および投稿は、TradingViewが提供または推奨する金融、投資、トレード、その他のアドバイスや推奨を意図するものではなく、それらを構成するものでもありません。詳細は利用規約をご覧ください。