OPEN-SOURCE SCRIPT
Omega Ratio
The Omega Ratio Indicator is a powerful tool designed to measure the risk-adjusted performance of an asset. Unlike traditional measures like the Sharpe or Sortino Ratios, the Omega Ratio considers both the frequency and magnitude of returns above and below a specified target return, providing a more comprehensive view of an asset's performance. This makes it an ideal choice for traders and investors seeking to evaluate the probability of achieving a desired return relative to the risk taken.
Features:
Calculation Period Input: Allows users to specify the period over which the Omega Ratio is calculated, making it flexible and adaptable to various trading strategies and time frames.
Target Return Input: Users can set a specific target return, enabling a customized risk-return analysis based on individual investment goals.
Daily Returns Calculation: The indicator calculates daily returns, which are used to determine the cumulative returns above and below the target return.
Omega Ratio Calculation: By dividing the cumulative returns above the target return by the cumulative returns below it, the indicator provides a clear measure of the likelihood of achieving the target return.
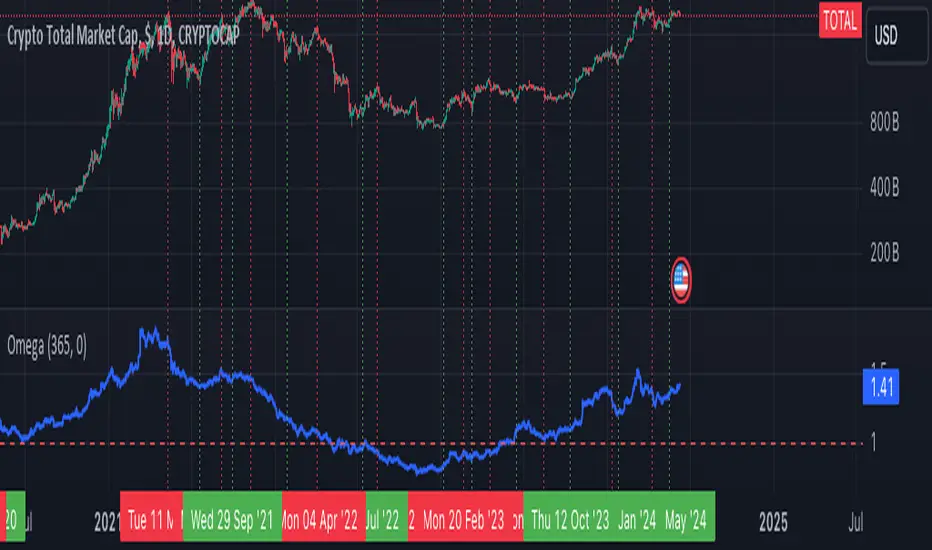
Visual Plot: The Omega Ratio is plotted on the chart, with a reference line at 1, helping users quickly assess whether the asset's returns are favorable relative to the target.
How to Use:
Add the Indicator to Your Chart: Copy the script into the Pine Script editor on TradingView and add it to your chart.
Specify the Calculation Period: Adjust the Calculation Period input to match your desired time frame for the Omega Ratio calculation.
Set the Target Return: Input your desired target return to customize the risk-return analysis.
Interpret the Omega Ratio: An Omega Ratio greater than 1 indicates that the asset's returns are more likely to exceed the target return than to fall short, whereas a ratio less than 1 suggests the opposite.
Features:
Calculation Period Input: Allows users to specify the period over which the Omega Ratio is calculated, making it flexible and adaptable to various trading strategies and time frames.
Target Return Input: Users can set a specific target return, enabling a customized risk-return analysis based on individual investment goals.
Daily Returns Calculation: The indicator calculates daily returns, which are used to determine the cumulative returns above and below the target return.
Omega Ratio Calculation: By dividing the cumulative returns above the target return by the cumulative returns below it, the indicator provides a clear measure of the likelihood of achieving the target return.
Visual Plot: The Omega Ratio is plotted on the chart, with a reference line at 1, helping users quickly assess whether the asset's returns are favorable relative to the target.
How to Use:
Add the Indicator to Your Chart: Copy the script into the Pine Script editor on TradingView and add it to your chart.
Specify the Calculation Period: Adjust the Calculation Period input to match your desired time frame for the Omega Ratio calculation.
Set the Target Return: Input your desired target return to customize the risk-return analysis.
Interpret the Omega Ratio: An Omega Ratio greater than 1 indicates that the asset's returns are more likely to exceed the target return than to fall short, whereas a ratio less than 1 suggests the opposite.
オープンソーススクリプト
TradingViewの精神に則り、このスクリプトの作者はコードをオープンソースとして公開してくれました。トレーダーが内容を確認・検証できるようにという配慮です。作者に拍手を送りましょう!無料で利用できますが、コードの再公開はハウスルールに従う必要があります。
免責事項
この情報および投稿は、TradingViewが提供または推奨する金融、投資、トレード、その他のアドバイスや推奨を意図するものではなく、それらを構成するものでもありません。詳細は利用規約をご覧ください。
オープンソーススクリプト
TradingViewの精神に則り、このスクリプトの作者はコードをオープンソースとして公開してくれました。トレーダーが内容を確認・検証できるようにという配慮です。作者に拍手を送りましょう!無料で利用できますが、コードの再公開はハウスルールに従う必要があります。
免責事項
この情報および投稿は、TradingViewが提供または推奨する金融、投資、トレード、その他のアドバイスや推奨を意図するものではなく、それらを構成するものでもありません。詳細は利用規約をご覧ください。