OPEN-SOURCE SCRIPT
更新済 Price vs 200 EMA Indicator
Purpose:
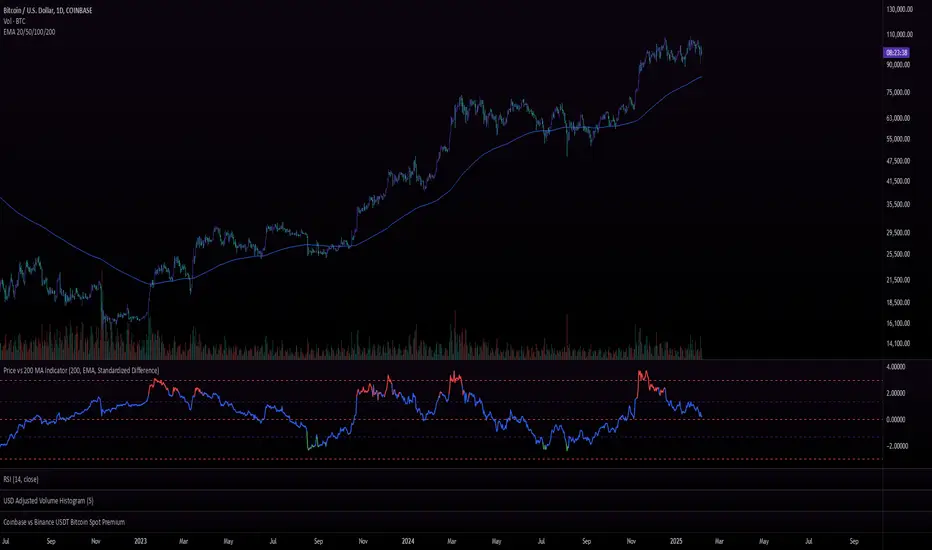
The Price vs. 200 MA (EMA) Indicator measures the deviation of the current price from its 200-period Exponential Moving Average (EMA). Instead of merely plotting the raw difference, the indicator calculates a standardized difference (similar to a z-score), which quantifies the deviation in terms of standard deviations over time. This helps traders understand how extreme the price is relative to its long-term average and its typical volatility.
Use Cases:
Trend Analysis:
Mean Reversion Strategy:
Trend Continuation or Exhaustion:
Summary:
The Price vs. 200 MA (EMA) Indicator calculates the standardized difference (z-score) between the price and its 200-period EMA, giving traders a normalized measure of how far the price is from its long-term average, relative to typical price volatility. The color-coded plot provides a clear visual representation of potential overbought/oversold conditions and highlights when the price has deviated significantly from the 200 EMA in either direction.
The Price vs. 200 MA (EMA) Indicator measures the deviation of the current price from its 200-period Exponential Moving Average (EMA). Instead of merely plotting the raw difference, the indicator calculates a standardized difference (similar to a z-score), which quantifies the deviation in terms of standard deviations over time. This helps traders understand how extreme the price is relative to its long-term average and its typical volatility.
Use Cases:
Trend Analysis:
Traders can use the standardized difference to assess how extreme the current price is relative to its long-term trend (200 EMA) while normalizing for volatility.
When the z-score approaches extreme levels (e.g., above 2 or below -2), it may indicate that the asset is overextended in either direction.
Mean Reversion Strategy:
Since the indicator identifies when the price deviates far from the 200 EMA (in terms of standard deviations), traders can use it to time mean-reversion trades, buying when the price is below -2 (oversold) and selling when it’s above +2 (overbought).
Trend Continuation or Exhaustion:
If the price continues to stay above +2 for extended periods, it could indicate a strong trend, whereas a reversion toward the EMA after reaching +2 or -2 could signal trend exhaustion or reversal.
Summary:
The Price vs. 200 MA (EMA) Indicator calculates the standardized difference (z-score) between the price and its 200-period EMA, giving traders a normalized measure of how far the price is from its long-term average, relative to typical price volatility. The color-coded plot provides a clear visual representation of potential overbought/oversold conditions and highlights when the price has deviated significantly from the 200 EMA in either direction.
リリースノート
Added option to change MA length.リリースノート
Added lines at 1.33 & -1.33Flags for crossing 0 are defaulted to off
リリースノート
.リリースノート
.オープンソーススクリプト
TradingViewの精神に則り、このスクリプトの作者はコードをオープンソースとして公開してくれました。トレーダーが内容を確認・検証できるようにという配慮です。作者に拍手を送りましょう!無料で利用できますが、コードの再公開はハウスルールに従う必要があります。
免責事項
この情報および投稿は、TradingViewが提供または推奨する金融、投資、トレード、その他のアドバイスや推奨を意図するものではなく、それらを構成するものでもありません。詳細は利用規約をご覧ください。
オープンソーススクリプト
TradingViewの精神に則り、このスクリプトの作者はコードをオープンソースとして公開してくれました。トレーダーが内容を確認・検証できるようにという配慮です。作者に拍手を送りましょう!無料で利用できますが、コードの再公開はハウスルールに従う必要があります。
免責事項
この情報および投稿は、TradingViewが提供または推奨する金融、投資、トレード、その他のアドバイスや推奨を意図するものではなく、それらを構成するものでもありません。詳細は利用規約をご覧ください。