OPEN-SOURCE SCRIPT
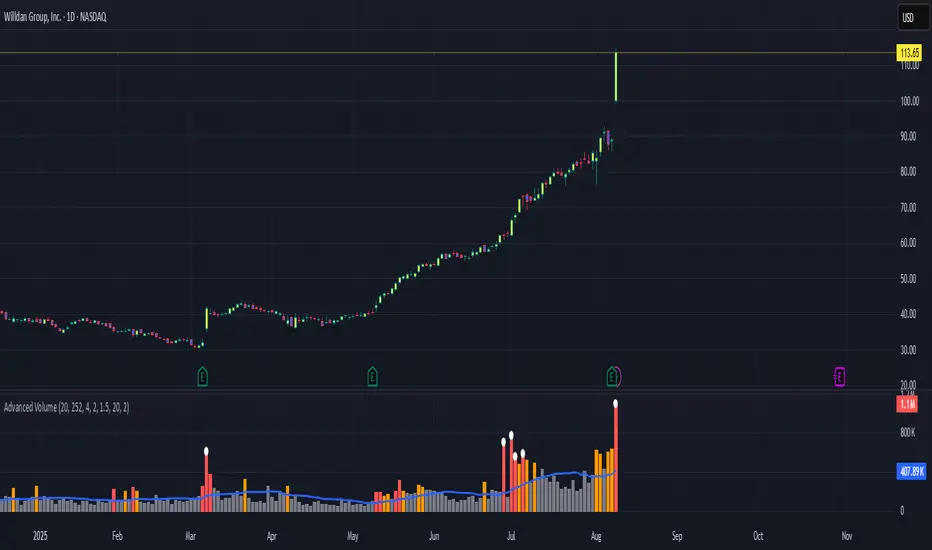
Relative Volume + Z-score + Normal Volume + Avg. Volume

A statistical way to visualize volume analytically compared to traditional volume. All Lookback Periods and Colors can be changed so user can make it feel personalized
- Relative Volume (RVOL) visualizer with the color of the histogram bar changing to represent exceeding a threshold specified by the user
For example --> (1.5 = Orange Bar) & (2 = Red Bar)
- Toggle View between RVOL visualization of volume vs. normal view of volume plot
- Z score lookback for volume across specified lookback per what user wants (dot/symbol above the bar)
- Average Volume Plot
オープンソーススクリプト
TradingViewの精神に則り、このスクリプトの作者はコードをオープンソースとして公開してくれました。トレーダーが内容を確認・検証できるようにという配慮です。作者に拍手を送りましょう!無料で利用できますが、コードの再公開はハウスルールに従う必要があります。
免責事項
この情報および投稿は、TradingViewが提供または推奨する金融、投資、トレード、その他のアドバイスや推奨を意図するものではなく、それらを構成するものでもありません。詳細は利用規約をご覧ください。
オープンソーススクリプト
TradingViewの精神に則り、このスクリプトの作者はコードをオープンソースとして公開してくれました。トレーダーが内容を確認・検証できるようにという配慮です。作者に拍手を送りましょう!無料で利用できますが、コードの再公開はハウスルールに従う必要があります。
免責事項
この情報および投稿は、TradingViewが提供または推奨する金融、投資、トレード、その他のアドバイスや推奨を意図するものではなく、それらを構成するものでもありません。詳細は利用規約をご覧ください。