OPEN-SOURCE SCRIPT
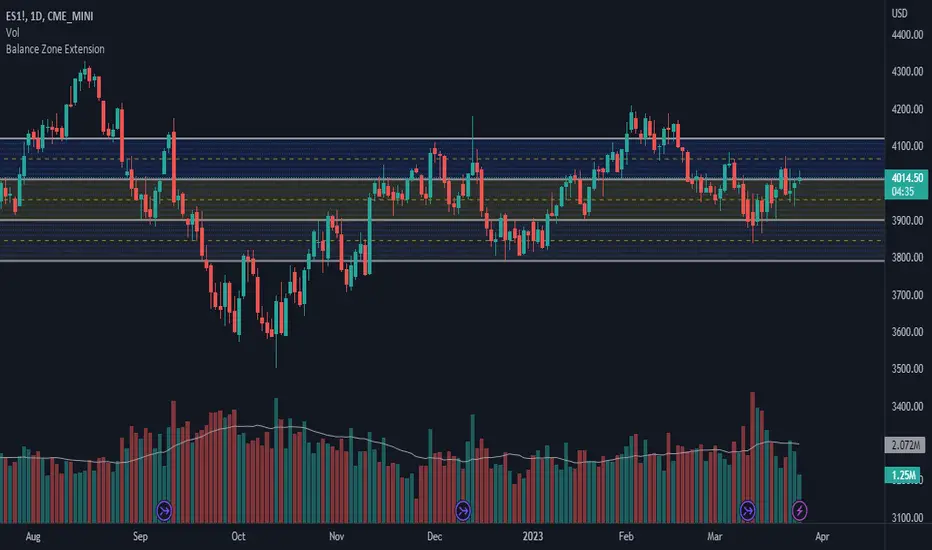
Balance Zone Extension

Balance zones are an aspect of trading that many traders notice. Balance Zones are formed when a market is in equilibrium and respects a certain high and low multiple times. These zones could also be called accumulation or distribution areas depending on the price action. If the term "choppy" is used to describe a given markets price action, it is probably a fair statement to say that the market is currently in a Balance Zone.
This script is a take on vwaptrader1's teachings where you take a balance zone and "double it" to get a target if/when it does break out of balance. It provides an automated way of extending levels based on a given balance range.
The lines plotted by the script are calculated based off of the balance high/low inputs, how many sections are desired per zone, and how many boxes to plot based on the other user inputs.
Warning: Due to a current limitation of the Pine, this script is only allowed to plot up to 500 lines total. If you start to notice lines starting to disappear or you begin getting a script error, double check the input settings as the script may have crossed the 500 line threshold.
This can be used in conjunction with Fixed Range Volume Profile . Select the balance range with the Fixed Volume Profile . Note the Value Area High and Value Area Low prices and input those into the balance range High/Low inputs.
Use to create price targets from Balance Zone Breakouts
A recent example of this idea in action on ticker ES1! 2 hour chart where the balance range was found and the target (double the box size of the balance range) was hit.

Another example of this same concept but on a normal security like AAPL but on a 30 minute chart:

Extending the usefulness even further to crypto on BTCUSD with a 5 minute chart:

Use to create reference levels for future price action
The other way to utilize this is to provide future reference levels from a key balance range from the past.
Here is another example utilizing the AMD daily chart . First, a balance zone was noted for all of 2017:

Moving forward to the most recent price action in 2023, notice that the box extension levels are still fairly well respected almost 6 years later!

This script is a take on vwaptrader1's teachings where you take a balance zone and "double it" to get a target if/when it does break out of balance. It provides an automated way of extending levels based on a given balance range.
The lines plotted by the script are calculated based off of the balance high/low inputs, how many sections are desired per zone, and how many boxes to plot based on the other user inputs.
Warning: Due to a current limitation of the Pine, this script is only allowed to plot up to 500 lines total. If you start to notice lines starting to disappear or you begin getting a script error, double check the input settings as the script may have crossed the 500 line threshold.
This can be used in conjunction with Fixed Range Volume Profile . Select the balance range with the Fixed Volume Profile . Note the Value Area High and Value Area Low prices and input those into the balance range High/Low inputs.
Use to create price targets from Balance Zone Breakouts
A recent example of this idea in action on ticker ES1! 2 hour chart where the balance range was found and the target (double the box size of the balance range) was hit.
Another example of this same concept but on a normal security like AAPL but on a 30 minute chart:
Extending the usefulness even further to crypto on BTCUSD with a 5 minute chart:
Use to create reference levels for future price action
The other way to utilize this is to provide future reference levels from a key balance range from the past.
Here is another example utilizing the AMD daily chart . First, a balance zone was noted for all of 2017:
Moving forward to the most recent price action in 2023, notice that the box extension levels are still fairly well respected almost 6 years later!
オープンソーススクリプト
TradingViewの精神に則り、このスクリプトの作者はコードをオープンソースとして公開してくれました。トレーダーが内容を確認・検証できるようにという配慮です。作者に拍手を送りましょう!無料で利用できますが、コードの再公開はハウスルールに従う必要があります。
免責事項
この情報および投稿は、TradingViewが提供または推奨する金融、投資、トレード、その他のアドバイスや推奨を意図するものではなく、それらを構成するものでもありません。詳細は利用規約をご覧ください。
オープンソーススクリプト
TradingViewの精神に則り、このスクリプトの作者はコードをオープンソースとして公開してくれました。トレーダーが内容を確認・検証できるようにという配慮です。作者に拍手を送りましょう!無料で利用できますが、コードの再公開はハウスルールに従う必要があります。
免責事項
この情報および投稿は、TradingViewが提供または推奨する金融、投資、トレード、その他のアドバイスや推奨を意図するものではなく、それらを構成するものでもありません。詳細は利用規約をご覧ください。