OPEN-SOURCE SCRIPT
Klinger Oscillator Advanced
アップデート済
The Klinger Oscillator is not fully implemented in Tradeview. While the description at de.tradingview.com/chart/?solution=43000589157 is complete, the implementation is limited to the pure current volume movement. This results in no difference compared to the On Balance Volume indicator.
However, Klinger's goal was to incorporate the trend as volume force in its strength and duration into the calculation. The expression ((V x [2 x ((dm/cm) - 1)] x T x 100)) for volume force only makes sense as an absolute value, which should probably be expressed as ((V x abs(2 x ((dm/cm) - 1)) x T x 100)). Additionally, there is a need to handle the theoretical possibility of cm == 0.
Since, in general, significantly more trading volume occurs at the closing price than during the day, an additional parameter for weighting the closing price is implemented. In intraday charts, considering the closing price, in my opinion, does not make sense.
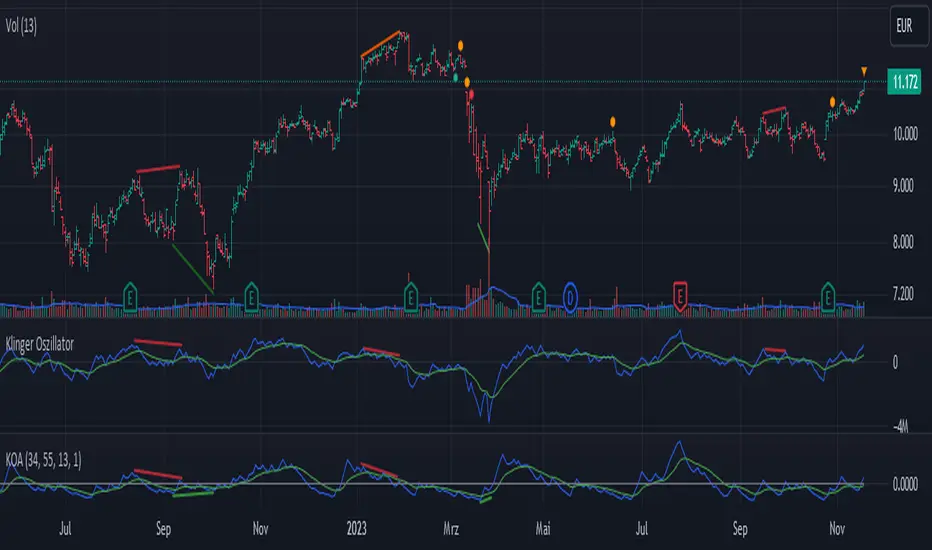
The TradeView implementation is displayed on the chart for comparison. Particularly in the analysis of divergence, significant deviations become apparent.
However, Klinger's goal was to incorporate the trend as volume force in its strength and duration into the calculation. The expression ((V x [2 x ((dm/cm) - 1)] x T x 100)) for volume force only makes sense as an absolute value, which should probably be expressed as ((V x abs(2 x ((dm/cm) - 1)) x T x 100)). Additionally, there is a need to handle the theoretical possibility of cm == 0.
Since, in general, significantly more trading volume occurs at the closing price than during the day, an additional parameter for weighting the closing price is implemented. In intraday charts, considering the closing price, in my opinion, does not make sense.
The TradeView implementation is displayed on the chart for comparison. Particularly in the analysis of divergence, significant deviations become apparent.
リリースノート
The Klinger Oscillator is not fully implemented in Tradeview. While the description at de.tradingview.com/chart/?solution=4... is complete, the implementation is limited to the pure current volume movement. This results in no difference compared to the On Balance Volume indicator.However, Klinger's goal was to incorporate the trend as volume force in its strength and duration into the calculation. The expression ((V x x T x 100)) for volume force only makes sense as an absolute value, which should probably be expressed as ((V x abs(2 x ((dm/cm) - 1)) x T x 100)). Additionally, there is a need to handle the theoretical possibility of cm == 0.
Since, in general, significantly more trading volume occurs at the closing price than during the day, an additional parameter for weighting the closing price is implemented. In intraday charts, considering the closing price, in my opinion, does not make sense.
The TradeView implementation is displayed on the chart for comparison. Particularly in the analysis of divergence, significant deviations become apparent.
Update
Deleting debugging info's an renew the char
オープンソーススクリプト
TradingViewの精神に則り、このスクリプトの作者は、トレーダーが理解し検証できるようにオープンソースで公開しています。作者に敬意を表します!無料で使用することができますが、このコードを投稿で再利用するには、ハウスルールに準拠する必要があります。 お気に入りに登録してチャート上でご利用頂けます。
免責事項
これらの情報および投稿は、TradingViewが提供または保証する金融、投資、取引、またはその他の種類のアドバイスや推奨を意図したものではなく、またそのようなものでもありません。詳しくは利用規約をご覧ください。