OPEN-SOURCE SCRIPT
Displacement [QuantVue]
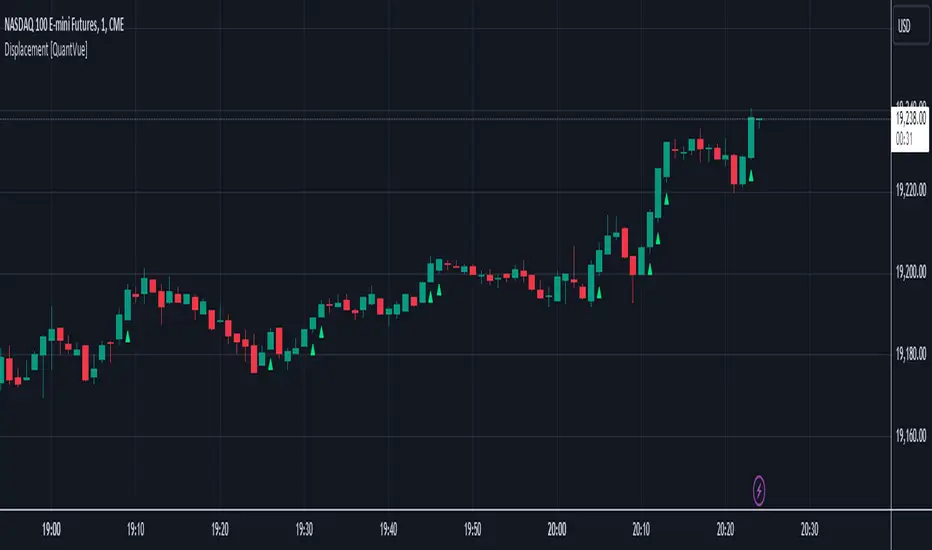
Displacement refers to a significant and forceful price movement that indicates a potential shift in market sentiment or trend. Displacement is characterized by a strong push in price action, often seen after a period of consolidation or within a trending market. It is a key concept used to identify the strength of a move and to confirm the direction of the market.
The "Displacement" indicator does this by focusing on identifying strong, directional price movements by combining candlestick analysis with volatility (ATR).
Displacement often appears as a group of candles that are all positioned in the same direction, these candles typically have large bodies and short wicks.
How the indicator works:
Body Size Requirement: Ensures that only candles with a significant body size (relative to their total range) are considered, helping to identify strong market moves.
Consecutive Candle Analysis: Identifies shifts in market sentiment by requiring a series of consecutive bullish or bearish candles to confirm a potential change in trend.
ATR-Based Analysis:Uses the Average True Range (ATR) to gauge market volatility and filter out minor price fluctuations, focusing on substantial movements.
Once all of the requirements are met a triangle is plotted above or below the bar.
オープンソーススクリプト
TradingViewの精神に則り、このスクリプトの作者はコードをオープンソースとして公開してくれました。トレーダーが内容を確認・検証できるようにという配慮です。作者に拍手を送りましょう!無料で利用できますが、コードの再公開はハウスルールに従う必要があります。
Get Access to the exclusive QuantVue indicators: quantvue.io/
Join thousands of traders in our Free Discord: discord.gg/tC7u7magU3
Join thousands of traders in our Free Discord: discord.gg/tC7u7magU3
免責事項
この情報および投稿は、TradingViewが提供または推奨する金融、投資、トレード、その他のアドバイスや推奨を意図するものではなく、それらを構成するものでもありません。詳細は利用規約をご覧ください。