OPEN-SOURCE SCRIPT
更新済 Ehler's Autocorrelation Periodogram - RSI/MFI
Warning! Frequently hits the execution time limit for scripts.
Especially on initially adding to your chart. Often requires toggling show/hide indicator to get it to complete script execution within the time limit. YMMV!
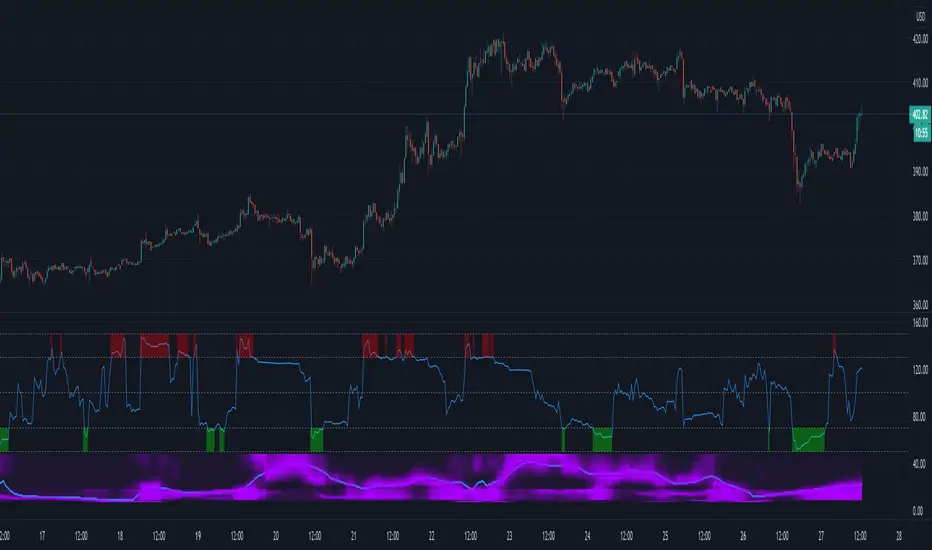
From TASC Sept 2016 this is Ehler's Autocorrelation periodogram. A means of determining the dominant cycle ("ideal" indicator length / dynamic length).
As an example it's applied here to RSI or MFI. Lower indicator segment displays the autocorrelation spectrum and the computed dominant cycle. Upper segment is RSI/MFI.
Especially on initially adding to your chart. Often requires toggling show/hide indicator to get it to complete script execution within the time limit. YMMV!
From TASC Sept 2016 this is Ehler's Autocorrelation periodogram. A means of determining the dominant cycle ("ideal" indicator length / dynamic length).
As an example it's applied here to RSI or MFI. Lower indicator segment displays the autocorrelation spectrum and the computed dominant cycle. Upper segment is RSI/MFI.
リリースノート
Corrected error in calculationリリースノート
Another fix and initial r valuesリリースノート
Corrected HP filterオープンソーススクリプト
TradingViewの精神に則り、このスクリプトの作者はコードをオープンソースとして公開してくれました。トレーダーが内容を確認・検証できるようにという配慮です。作者に拍手を送りましょう!無料で利用できますが、コードの再公開はハウスルールに従う必要があります。
免責事項
この情報および投稿は、TradingViewが提供または推奨する金融、投資、トレード、その他のアドバイスや推奨を意図するものではなく、それらを構成するものでもありません。詳細は利用規約をご覧ください。
オープンソーススクリプト
TradingViewの精神に則り、このスクリプトの作者はコードをオープンソースとして公開してくれました。トレーダーが内容を確認・検証できるようにという配慮です。作者に拍手を送りましょう!無料で利用できますが、コードの再公開はハウスルールに従う必要があります。
免責事項
この情報および投稿は、TradingViewが提供または推奨する金融、投資、トレード、その他のアドバイスや推奨を意図するものではなく、それらを構成するものでもありません。詳細は利用規約をご覧ください。