OPEN-SOURCE SCRIPT
SMIIO + Volume
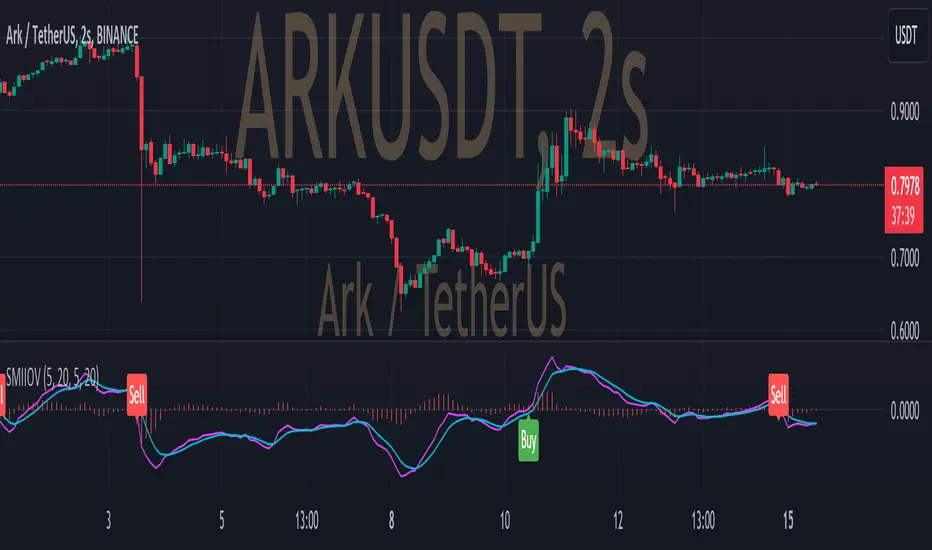
This indicator generates long and short signals.
The operation of the indicator is as follows;
First, true strength index is calculated with closing prices. We call this the "ergodic" curve.
Then the average of the ergodic (ema) is calculated to obtain the "signal" curve.
To calculate the "oscillator", the signal is subtracted from ergodic (oscillator = ergodic - signal).
The last variable to be used in the calculation is the average volume, calculated with sma.
Calculation for long signal;
- If the ergodic curve cross up the zero line (ergodic > 0 AND ergodic[1] < 0) and,
- If the current oscillator is greater than the previous oscillator (oscillator > oscillator[1]) and,
- If the current ergonic is greater than the previous signal (ergonic > signal) and,
- If the current volume is greater than the average volume (volume > averageVolume) and,
- If the current candle closing price is greater than the opening price (close > open)
If all the above conditions are fullfilled, the long input signal is issued with "Buy" label.
Calculation for short signal;
- If the ergodic curve cross down the zero line (ergodic < 0 AND ergodic[1] > 0) and,
- If the current oscillator is smaller than the previous oscillator (oscillator < oscillator[1]) and,
- If the current ergonic is smaller than the previous signal (ergonic < signal) and,
- If the current volume is greater than the average volume (volume > averageVolume) and,
- If the current candle closing price is smaller than the opening price (close < open)
If all the above conditions are fullfilled, the short input signal is issued with "Sell" label.
オープンソーススクリプト
TradingViewの精神に則り、このスクリプトの作者はコードをオープンソースとして公開してくれました。トレーダーが内容を確認・検証できるようにという配慮です。作者に拍手を送りましょう!無料で利用できますが、コードの再公開はハウスルールに従う必要があります。
免責事項
この情報および投稿は、TradingViewが提供または推奨する金融、投資、トレード、その他のアドバイスや推奨を意図するものではなく、それらを構成するものでもありません。詳細は利用規約をご覧ください。
オープンソーススクリプト
TradingViewの精神に則り、このスクリプトの作者はコードをオープンソースとして公開してくれました。トレーダーが内容を確認・検証できるようにという配慮です。作者に拍手を送りましょう!無料で利用できますが、コードの再公開はハウスルールに従う必要があります。
免責事項
この情報および投稿は、TradingViewが提供または推奨する金融、投資、トレード、その他のアドバイスや推奨を意図するものではなく、それらを構成するものでもありません。詳細は利用規約をご覧ください。