OPEN-SOURCE SCRIPT
更新済 Multi Timeframe Moving Average Selector
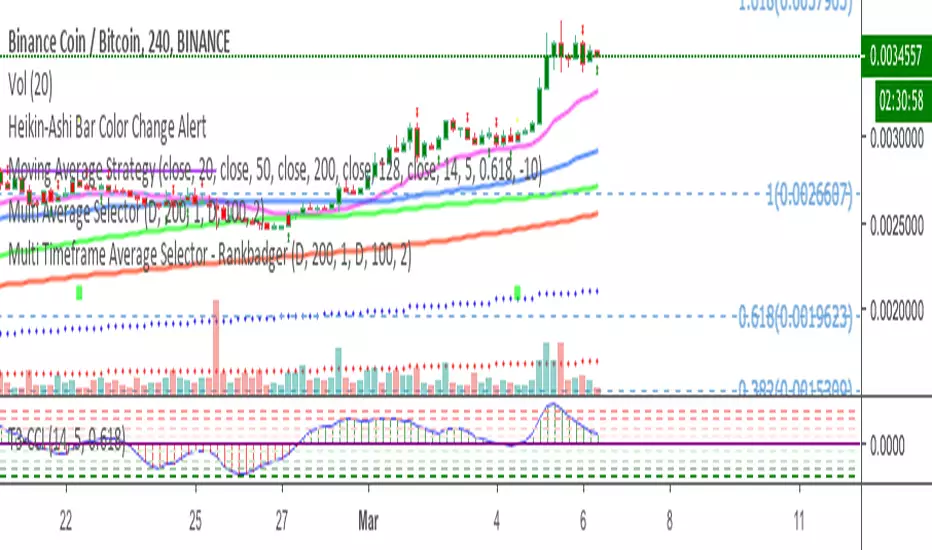
This allows you to plot a moving average on a different timeframe to the one you are viewing.
For instance if you are on a 4hr chart, you can plot the position of the daily 200MA, 100EMA etc
On a 15min chart you could plot where the hourly MAs are.
You can define the length of the MA and the style, EMA, SMA Hull MA etc, the colour and the type.
As with all my scripts I have pinched bits of other peoples and spliced them together with my own bits and bobs. Credit where it's due but I don't even know where most of this came from, it's pretty bothed together.
Feedback appreciated
リリースノート
Update to include another MA defaults to 100EMAリリースノート
Changed line to small dots so it stands outリリースノート
updateオープンソーススクリプト
TradingViewの精神に則り、このスクリプトの作者はコードをオープンソースとして公開してくれました。トレーダーが内容を確認・検証できるようにという配慮です。作者に拍手を送りましょう!無料で利用できますが、コードの再公開はハウスルールに従う必要があります。
免責事項
この情報および投稿は、TradingViewが提供または推奨する金融、投資、トレード、その他のアドバイスや推奨を意図するものではなく、それらを構成するものでもありません。詳細は利用規約をご覧ください。
オープンソーススクリプト
TradingViewの精神に則り、このスクリプトの作者はコードをオープンソースとして公開してくれました。トレーダーが内容を確認・検証できるようにという配慮です。作者に拍手を送りましょう!無料で利用できますが、コードの再公開はハウスルールに従う必要があります。
免責事項
この情報および投稿は、TradingViewが提供または推奨する金融、投資、トレード、その他のアドバイスや推奨を意図するものではなく、それらを構成するものでもありません。詳細は利用規約をご覧ください。