OPEN-SOURCE SCRIPT
更新済 Wave Line

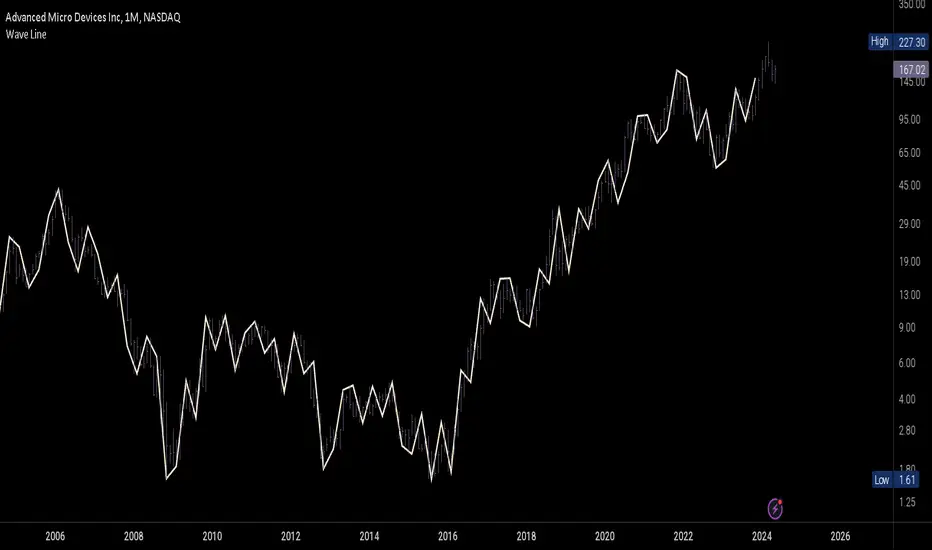
Wave Line is a chart type obtained by plotting the High and Low values in each time interval according to their sequential order. This method produces a continuous line rather than bars, which is beneficial for analyzing changes within each interval rather than focusing on the price range and open/close values. E.g for Wave Analysis.
How to use:
1. Adjust the interval unit and multiplier for the main timeframe.
2. Ideally, select a lower timeframe on your chart, approximately 5 times smaller than the one specified for the script.
3. Lower Timeframe is the timeframe which will be the scripts reference when the high and low of the main timeframe align on a single bar of the opened chart. This timeframe may also be 5-10 times smaller than the main timeframe. It is important to note that this should not be excessively smaller as the script may fail in retrieving data. An alternative method is included to estimate the order if it is not clear in the fetched data.
4. Set a preferred value for Monowave Length, indicating the number of bars a monowave will cover horizontally. Set the value to be half of the Interval Multiplier for the Wave Line to align with the bar chart. However if the multiplier is an odd number, perfect alignment may not be achieved.
5. Ensure that the product of Max Polyline Segments and Monowave length does not exceed 5000, and adjust the value for Max Polyline Segments accordingly.
リリースノート
- The script now verifies the compatibility of the chart timeframe. If the specified main timeframe (interval unit and its multiplier) can not be evenly divided by the chart timeframe, a runtime error will be triggered.- An error message will be displayed if the available chart bars do not fully cover the specified timeframe.
When using chart timeframes with a larger unit than the script's interval unit, the script will handle months as 30 days or 4 weeks.
Regarding questions related to setting periods using decimal values, a lower-level interval unit should be selected. For instance, to achieve a 2.5-year period, one should select the monthly interval unit and set the multiplier to 30. Just as we approach periods denoted by decimal hours, such as 0.5-hour or 0.75-hour durations.
オープンソーススクリプト
TradingViewの精神に則り、このスクリプトの作者はコードをオープンソースとして公開してくれました。トレーダーが内容を確認・検証できるようにという配慮です。作者に拍手を送りましょう!無料で利用できますが、コードの再公開はハウスルールに従う必要があります。
免責事項
この情報および投稿は、TradingViewが提供または推奨する金融、投資、トレード、その他のアドバイスや推奨を意図するものではなく、それらを構成するものでもありません。詳細は利用規約をご覧ください。
オープンソーススクリプト
TradingViewの精神に則り、このスクリプトの作者はコードをオープンソースとして公開してくれました。トレーダーが内容を確認・検証できるようにという配慮です。作者に拍手を送りましょう!無料で利用できますが、コードの再公開はハウスルールに従う必要があります。
免責事項
この情報および投稿は、TradingViewが提供または推奨する金融、投資、トレード、その他のアドバイスや推奨を意図するものではなく、それらを構成するものでもありません。詳細は利用規約をご覧ください。