OPEN-SOURCE SCRIPT
更新済 Extended Parallel Channels
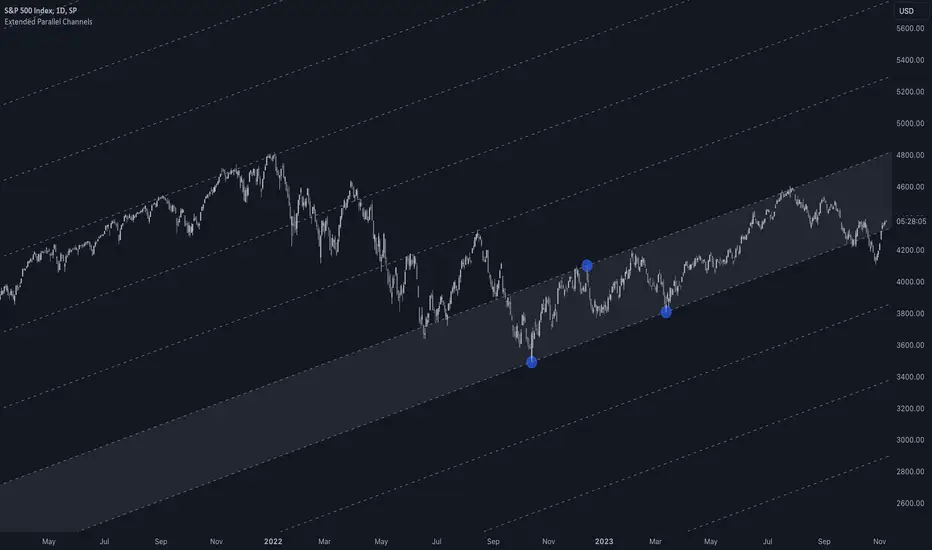
This indicator provides an enhanced version of the popular Parallel Channel tool by allowing channel boundaries to be extended above and below the primary channel. It can also serve as a general tool for drawing parallel lines and grid lines to aid technical analysis.
🟠 Application
There are two primary ways extended channels can provide valuable insights:
🔵 Support and Resistance Levels
When prices break out of a channel, they often encounter strong resistance at approximately the 100% extension point. Breakout traders can utilize the extended channel boundary to place take-profit orders. Meanwhile, reversal traders can look for entry opportunities at this level.

🔵 Grid / Martingale Trading
Grid Trading and Martingale Trading strategies rely heavily on grid lines. This indicator streamlines that process by enabling traders to effortlessly plot grid lines across the chart.
🟠 Instructions
Upon adding the indicator, the user will be prompted to set the channel boundaries by placing three anchor points on the chart. The first two anchors determine one boundary line, while the third anchor determine the other boundary line.
Once the three anchors are positioned, the indicator automatically plots the resulting channel as well as the extended lines. The anchor points are highlighted as movable blue circles, allowing the user to dynamically adjust the channel formation by dragging the anchors to new locations as needed.
🟠 Application
There are two primary ways extended channels can provide valuable insights:
🔵 Support and Resistance Levels
When prices break out of a channel, they often encounter strong resistance at approximately the 100% extension point. Breakout traders can utilize the extended channel boundary to place take-profit orders. Meanwhile, reversal traders can look for entry opportunities at this level.
🔵 Grid / Martingale Trading
Grid Trading and Martingale Trading strategies rely heavily on grid lines. This indicator streamlines that process by enabling traders to effortlessly plot grid lines across the chart.
🟠 Instructions
Upon adding the indicator, the user will be prompted to set the channel boundaries by placing three anchor points on the chart. The first two anchors determine one boundary line, while the third anchor determine the other boundary line.
Once the three anchors are positioned, the indicator automatically plots the resulting channel as well as the extended lines. The anchor points are highlighted as movable blue circles, allowing the user to dynamically adjust the channel formation by dragging the anchors to new locations as needed.
リリースノート
Added support for retaining the same channels when switching the chart to a higher timeframe.オープンソーススクリプト
TradingViewの精神に則り、このスクリプトの作者はコードをオープンソースとして公開してくれました。トレーダーが内容を確認・検証できるようにという配慮です。作者に拍手を送りましょう!無料で利用できますが、コードの再公開はハウスルールに従う必要があります。
专业缠论指标: alphaviz.pro/chanlun
Email: contact@alphaviz.pro
Discord: discord.gg/w2fFtNega4
Email: contact@alphaviz.pro
Discord: discord.gg/w2fFtNega4
免責事項
この情報および投稿は、TradingViewが提供または推奨する金融、投資、トレード、その他のアドバイスや推奨を意図するものではなく、それらを構成するものでもありません。詳細は利用規約をご覧ください。
オープンソーススクリプト
TradingViewの精神に則り、このスクリプトの作者はコードをオープンソースとして公開してくれました。トレーダーが内容を確認・検証できるようにという配慮です。作者に拍手を送りましょう!無料で利用できますが、コードの再公開はハウスルールに従う必要があります。
专业缠论指标: alphaviz.pro/chanlun
Email: contact@alphaviz.pro
Discord: discord.gg/w2fFtNega4
Email: contact@alphaviz.pro
Discord: discord.gg/w2fFtNega4
免責事項
この情報および投稿は、TradingViewが提供または推奨する金融、投資、トレード、その他のアドバイスや推奨を意図するものではなく、それらを構成するものでもありません。詳細は利用規約をご覧ください。