OPEN-SOURCE SCRIPT
Risk On Risk Off
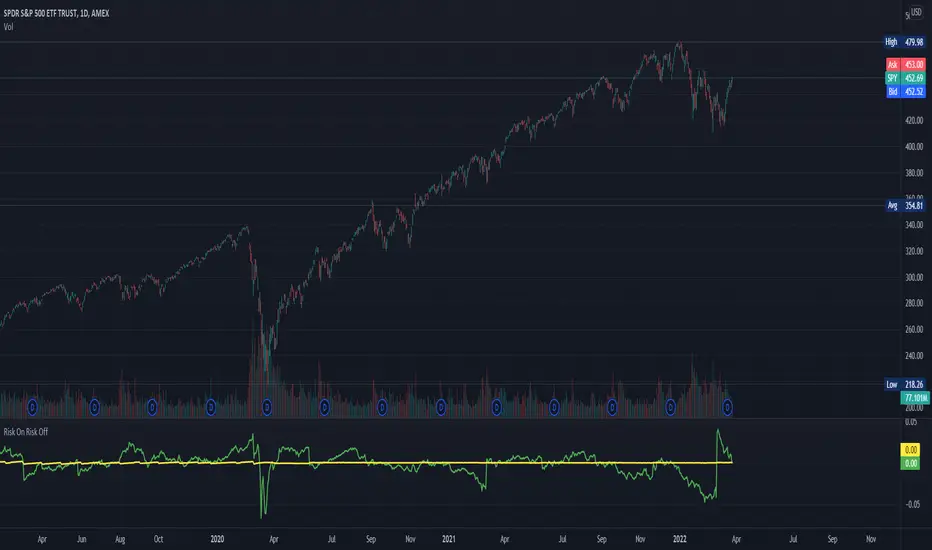
A helpful indicator for those who follow a systematic long-term investment approach.
What it shows:
It shows the 60 Day Cumulative Return of BND Vanguard Total Bond Market ETF against the 60 Day Cumulative Return of
  BIL SPDR Bloomberg Barclays 1-3 Month T-Bill ETF.
Why:
This Indicator will provide you a sense of where the economic environment is at, if the indicator shows that the 60 Day Cumulative return ofBND is ABOVE BIL, it means that it's a good idea to go Risk ON in the stock market; On the other hand, if the inverse is true, it means that is a good idea to go Risk OFF in the stock market.
Example Uses:
Warren Buffet often advice Investors to just buy a S&P500 index tracking ETF likeSPY consistently and you will likely to be making money in the long-term.
With this indicator you will be able to make the Buffet Strategy even simpler: when the indicator shows Risk ON, buy theSPY; when the indicator shows Risk OFF, consider hedges like  IEF iShares 7-10 Year Treasury Bond ETF.SPY
What it shows:
It shows the 60 Day Cumulative Return of
Why:
This Indicator will provide you a sense of where the economic environment is at, if the indicator shows that the 60 Day Cumulative return of
Example Uses:
Warren Buffet often advice Investors to just buy a S&P500 index tracking ETF like
With this indicator you will be able to make the Buffet Strategy even simpler: when the indicator shows Risk ON, buy the
オープンソーススクリプト
TradingViewの精神に則り、このスクリプトの作者はコードをオープンソースとして公開してくれました。トレーダーが内容を確認・検証できるようにという配慮です。作者に拍手を送りましょう!無料で利用できますが、コードの再公開はハウスルールに従う必要があります。
免責事項
この情報および投稿は、TradingViewが提供または推奨する金融、投資、トレード、その他のアドバイスや推奨を意図するものではなく、それらを構成するものでもありません。詳細は利用規約をご覧ください。
オープンソーススクリプト
TradingViewの精神に則り、このスクリプトの作者はコードをオープンソースとして公開してくれました。トレーダーが内容を確認・検証できるようにという配慮です。作者に拍手を送りましょう!無料で利用できますが、コードの再公開はハウスルールに従う必要があります。
免責事項
この情報および投稿は、TradingViewが提供または推奨する金融、投資、トレード、その他のアドバイスや推奨を意図するものではなく、それらを構成するものでもありません。詳細は利用規約をご覧ください。