OPEN-SOURCE SCRIPT
1337 Volume
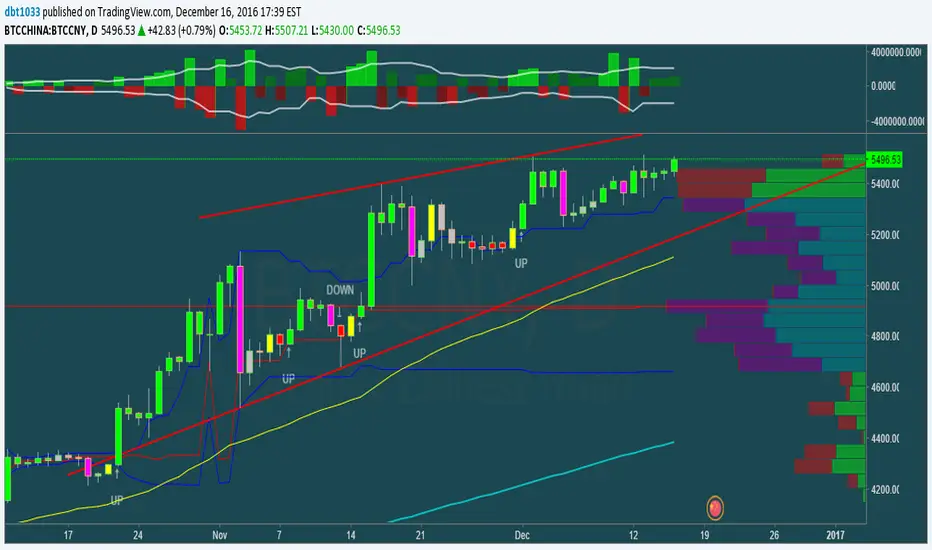
This volume indicator gives you a unique perspective and ability to analyze volume in any market. The upper line that is always >=0 represents average up volume over a user definable period while the lower line that is always <= 0 represents the average down volume over a user definable period.
green == bullish candle but volume lower than average
lime == bullish candle with above average volume
crimson == bearish candle with below average volume
red == bearish candle with above average volume
This indicator is very useful for spotting bottoms / tops (do a visual backtest and observe its behavior) as well as entry opportunities.
By default, the lookback period for average volume is 7, but I encourage you to change this value in order to find settings that work best for your particular market.
If you have any feedback or ideas for improvement, please comment.
Enjoy :D
オープンソーススクリプト
TradingViewの精神に則り、このスクリプトの作者はコードをオープンソースとして公開してくれました。トレーダーが内容を確認・検証できるようにという配慮です。作者に拍手を送りましょう!無料で利用できますが、コードの再公開はハウスルールに従う必要があります。
免責事項
この情報および投稿は、TradingViewが提供または推奨する金融、投資、トレード、その他のアドバイスや推奨を意図するものではなく、それらを構成するものでもありません。詳細は利用規約をご覧ください。
オープンソーススクリプト
TradingViewの精神に則り、このスクリプトの作者はコードをオープンソースとして公開してくれました。トレーダーが内容を確認・検証できるようにという配慮です。作者に拍手を送りましょう!無料で利用できますが、コードの再公開はハウスルールに従う必要があります。
免責事項
この情報および投稿は、TradingViewが提供または推奨する金融、投資、トレード、その他のアドバイスや推奨を意図するものではなく、それらを構成するものでもありません。詳細は利用規約をご覧ください。