OPEN-SOURCE SCRIPT
Relative Strength Index & Stochastic RSI
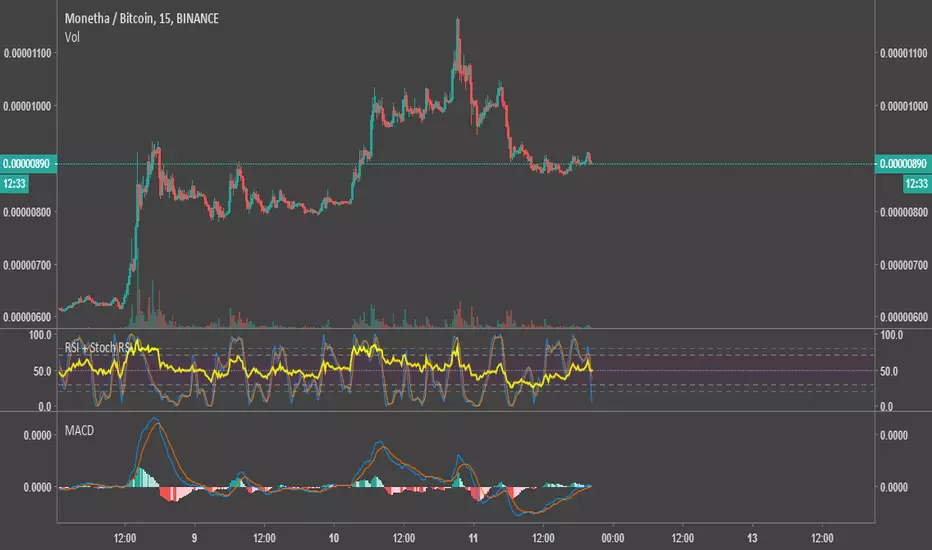
This script calculates both RSI (Relative Strength Index) and Stock (Stochastic) RSI Indicators, and plots them with a distinctive background on the same graph. The colors were chosen to be very easy on the eyes.
I published it as a way to give back to this community. Use your own judgement when trading, I am not responsible for any losses resulting from the use of my script.
Feel free to modify the script with no attribution.
I published it as a way to give back to this community. Use your own judgement when trading, I am not responsible for any losses resulting from the use of my script.
Feel free to modify the script with no attribution.
オープンソーススクリプト
TradingViewの精神に則り、このスクリプトの作者はコードをオープンソースとして公開してくれました。トレーダーが内容を確認・検証できるようにという配慮です。作者に拍手を送りましょう!無料で利用できますが、コードの再公開はハウスルールに従う必要があります。
免責事項
この情報および投稿は、TradingViewが提供または推奨する金融、投資、トレード、その他のアドバイスや推奨を意図するものではなく、それらを構成するものでもありません。詳細は利用規約をご覧ください。
オープンソーススクリプト
TradingViewの精神に則り、このスクリプトの作者はコードをオープンソースとして公開してくれました。トレーダーが内容を確認・検証できるようにという配慮です。作者に拍手を送りましょう!無料で利用できますが、コードの再公開はハウスルールに従う必要があります。
免責事項
この情報および投稿は、TradingViewが提供または推奨する金融、投資、トレード、その他のアドバイスや推奨を意図するものではなく、それらを構成するものでもありません。詳細は利用規約をご覧ください。