OPEN-SOURCE SCRIPT
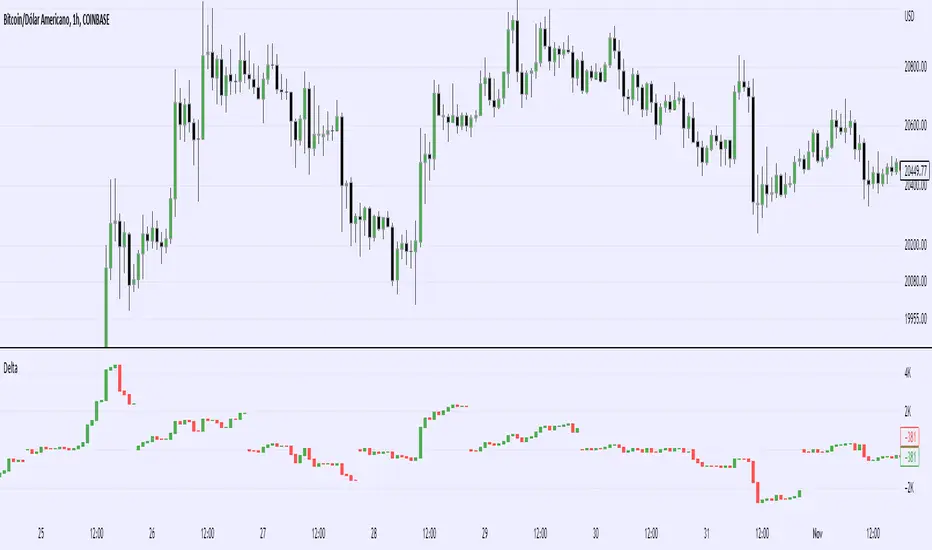
更新済 Real Cummulative Delta (New TV Function)

Thanks to the new TradingView indicator Up/Down Volume, it is now possible to get accurate information on Agression (market buying vs market selling)
However, as they only provide the value of delta, I've made this indicator to show the cummulative value, in the form of candles.
It is great to detect divergences in the macro and in the micro scale (As in divergences in each candle and divergences in higher or lower tops or bottoms)
Hope you can make good use of it!
リリースノート
Oops I made it not visible on Daily charts, should be fixed nowリリースノート
Fixed indicator not visible on certain assets and timeframesPS: Traders e investidores Brasileiros em busca de um Assessor XP Investimentos dedicado e capaz de criar e utilizar ferramentas de qualidade para trazer o melhor acompanhamento aos seus clientes, podem entrar em contato comigo aqui nos comentários ou via DM no Twitter
リリースノート
Added option to choose wether to reset on start of day/month/year.オープンソーススクリプト
TradingViewの精神に則り、このスクリプトの作者はコードをオープンソースとして公開してくれました。トレーダーが内容を確認・検証できるようにという配慮です。作者に拍手を送りましょう!無料で利用できますが、コードの再公開はハウスルールに従う必要があります。
免責事項
この情報および投稿は、TradingViewが提供または推奨する金融、投資、トレード、その他のアドバイスや推奨を意図するものではなく、それらを構成するものでもありません。詳細は利用規約をご覧ください。
オープンソーススクリプト
TradingViewの精神に則り、このスクリプトの作者はコードをオープンソースとして公開してくれました。トレーダーが内容を確認・検証できるようにという配慮です。作者に拍手を送りましょう!無料で利用できますが、コードの再公開はハウスルールに従う必要があります。
免責事項
この情報および投稿は、TradingViewが提供または推奨する金融、投資、トレード、その他のアドバイスや推奨を意図するものではなく、それらを構成するものでもありません。詳細は利用規約をご覧ください。