OPEN-SOURCE SCRIPT
High Volume Engulfing Candle_bullHorn
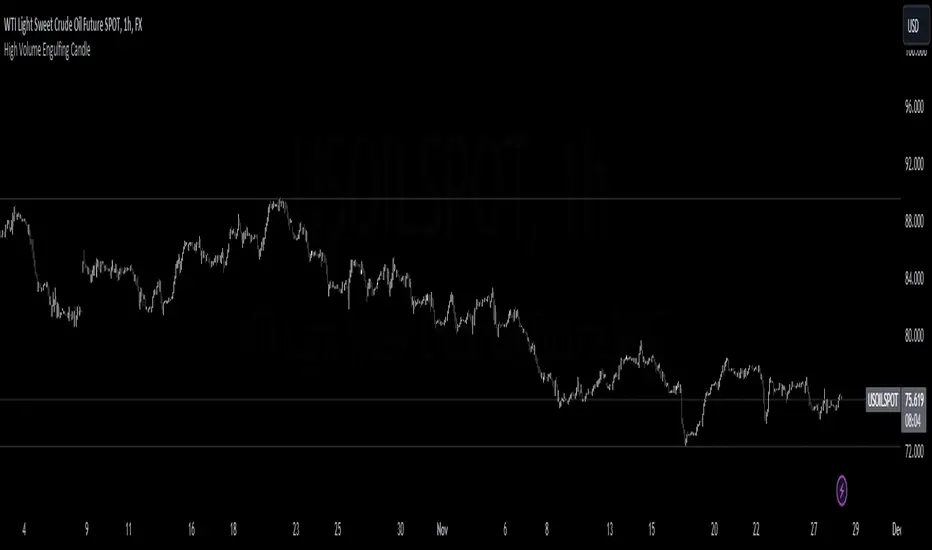
The "High Volume Engulfing Candle" indicator is a technical analysis tool used in trading to identify specific candlestick patterns that suggest potential reversals or significant price movements in a financial instrument. It focuses on two key criteria: the engulfing candlestick pattern and high trading volume. Here's a brief description of the indicator:
Engulfing Candlestick Pattern: The indicator looks for bullish and bearish engulfing candlestick patterns.
Bullish Engulfing: This pattern occurs when the current candlestick completely engulfs the previous one. In other words, the current candlestick's body (the open and close prices) is larger than the previous candlestick's body, and it closes higher than the previous candle's close. It suggests a potential bullish reversal.
Bearish Engulfing: This pattern occurs when the current candlestick's body completely engulfs the previous one, but in the opposite direction. The current candlestick's body is larger than the previous candlestick's body, and it closes lower than the previous candle's close. It suggests a potential bearish reversal.
High Volume Confirmation: In addition to the engulfing pattern, the indicator considers trading volume. It looks for instances where the volume accompanying the engulfing candle is significantly higher than a moving average of the volume. This indicates strong market participation and validates the importance of the engulfing candle pattern.
Arrows on the Chart: When a high volume engulfing candle pattern is detected, the indicator plots arrows on the price chart. A green triangle pointing up is used for bullish engulfing patterns, while a red triangle pointing down is used for bearish engulfing patterns. These arrows help traders quickly identify potential reversal points.
Overall, the "High Volume Engulfing Candle" indicator combines the visual recognition of candlestick patterns with volume analysis to provide traders with potential signals for trend reversals or significant price moves in the market. Traders can use these signals as part of their technical analysis and trading strategies.
オープンソーススクリプト
TradingViewの精神に則り、このスクリプトの作者はコードをオープンソースとして公開してくれました。トレーダーが内容を確認・検証できるようにという配慮です。作者に拍手を送りましょう!無料で利用できますが、コードの再公開はハウスルールに従う必要があります。
免責事項
この情報および投稿は、TradingViewが提供または推奨する金融、投資、トレード、その他のアドバイスや推奨を意図するものではなく、それらを構成するものでもありません。詳細は利用規約をご覧ください。
オープンソーススクリプト
TradingViewの精神に則り、このスクリプトの作者はコードをオープンソースとして公開してくれました。トレーダーが内容を確認・検証できるようにという配慮です。作者に拍手を送りましょう!無料で利用できますが、コードの再公開はハウスルールに従う必要があります。
免責事項
この情報および投稿は、TradingViewが提供または推奨する金融、投資、トレード、その他のアドバイスや推奨を意図するものではなく、それらを構成するものでもありません。詳細は利用規約をご覧ください。