OPEN-SOURCE SCRIPT
更新済 Normalized True Range - Grouped by Weekdays
This indicator helps traders analyze daily volatility patterns across different days of the week by calculating normalized price ranges.
These bounds appear as horizontal lines on the chart, making it easy to spot when current volatility breaks out of its historical norms.
These bounds appear as horizontal lines on the chart, making it easy to spot when current volatility breaks out of its historical norms.
リリースノート
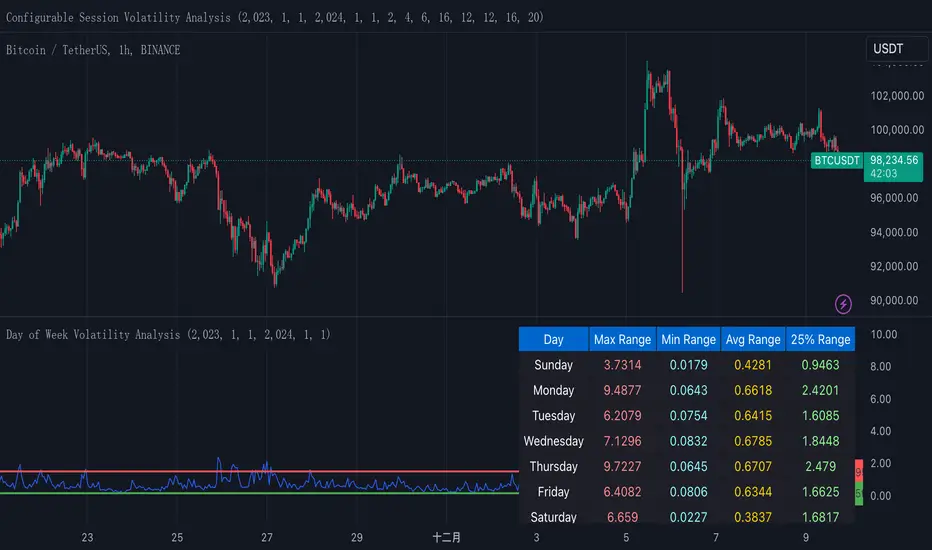
This indicator helps traders analyze daily volatility patterns across different days of the week by calculating normalized price ranges.Unlike traditional volatility measures, it uses a normalized approach by dividing the daily range (high-low) by the midpoint price and multiplying by 100, providing a percentage-based measure that's comparable across different price levels. This normalization makes it particularly useful for comparing volatility patterns across different assets or time periods.
The indicator also includes a statistical overlay that highlights extreme volatility events. By calculating the 5th and 95th percentiles of the normalized ranges within your specified date range, it creates upper and lower bounds that help identify outlier days where volatility was exceptionally high or low.
These bounds appear as horizontal lines on the chart, making it easy to spot when current volatility breaks out of its historical norms.
The data is presented in both visual and tabular formats, with a comprehensive table showing the maximum, minimum, average, and 25th percentile ranges for each day of the week. This dual presentation allows traders to both quickly spot patterns visually and access detailed statistics for deeper analysis.
The user can customize the analysis period through simple date range inputs, making it flexible for different analytical timeframes.
オープンソーススクリプト
TradingViewの精神に則り、このスクリプトの作者はコードをオープンソースとして公開してくれました。トレーダーが内容を確認・検証できるようにという配慮です。作者に拍手を送りましょう!無料で利用できますが、コードの再公開はハウスルールに従う必要があります。
免責事項
この情報および投稿は、TradingViewが提供または推奨する金融、投資、トレード、その他のアドバイスや推奨を意図するものではなく、それらを構成するものでもありません。詳細は利用規約をご覧ください。
オープンソーススクリプト
TradingViewの精神に則り、このスクリプトの作者はコードをオープンソースとして公開してくれました。トレーダーが内容を確認・検証できるようにという配慮です。作者に拍手を送りましょう!無料で利用できますが、コードの再公開はハウスルールに従う必要があります。
免責事項
この情報および投稿は、TradingViewが提供または推奨する金融、投資、トレード、その他のアドバイスや推奨を意図するものではなく、それらを構成するものでもありません。詳細は利用規約をご覧ください。