INVITE-ONLY SCRIPT
Multi-Symbol Options Trading Indicator
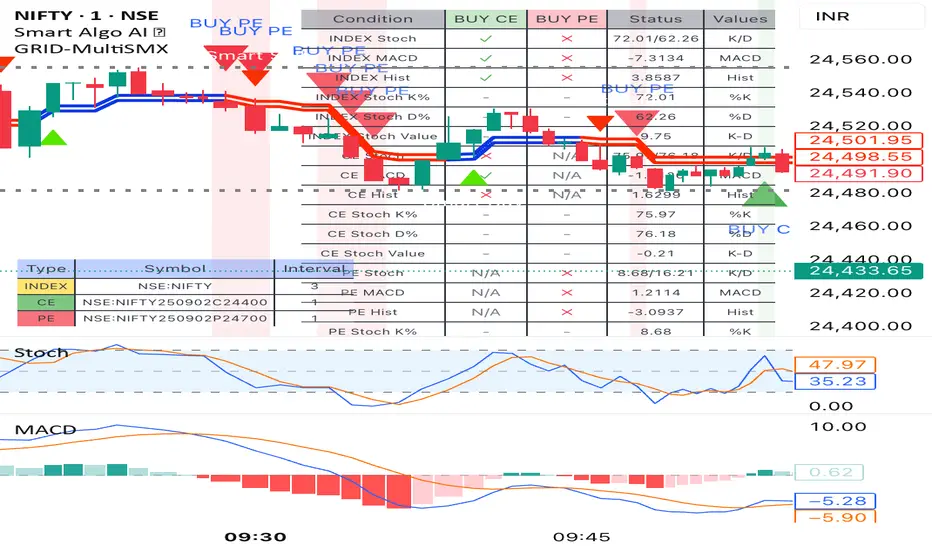
Symbol Configuration: User can input three different symbols (INDEX, CE, PE) with individual timeframes
Customizable Settings: Fully editable MACD and Stochastic parameters
Signal Generation:
BUY CE: When INDEX shows bullish signals AND CE option shows bullish signals
BUY PE: When INDEX shows bearish signals AND PE option shows bullish signals
Signal Conditions:
BUY CE Signal (all must be true):
INDEX: Stochastic %K > %D
INDEX: MACD line > Signal line
INDEX: Histogram shows bullish trend over specified bars
CE: Stochastic %K > %D
CE: MACD line > Signal line
CE: Histogram shows bullish trend over specified bars
BUY PE Signal (all must be true):
INDEX: Stochastic %K < %D
INDEX: MACD line < Signal line
INDEX: Histogram shows bearish trend over specified bars
PE: Stochastic %K > %D
PE: MACD line > Signal line
PE: Histogram shows bullish trend over specified bars
Visual Elements:
Green triangle up with "BUY CE" text when CE signal triggers
Red triangle down with "BUY PE" text when PE signal triggers
Background coloring on signal candles
Conditions table showing real-time status of all conditions
Alerts for both signal types
Usage Instructions:
Add the indicator to your chart
Configure your three symbols (INDEX, CE option, PE option)
Set timeframes for each symbol
Adjust MACD and Stochastic parameters as needed
Set the number of histogram bars for trend analysis
Enable/disable the conditions table and choose its position
The table will show you exactly which conditions are met (✓) or not met (✗) for both signal types, making it easy to monitor the setup in real-time.
招待専用スクリプト
このスクリプトは作者が承認したユーザーのみアクセス可能です。使用するにはアクセス申請をして許可を得る必要があります。通常は支払い後に承認されます。詳細は下記の作者の指示に従うか、sailor_joeに直接お問い合わせください。
TradingViewは、作者を完全に信頼し、スクリプトの動作を理解していない限り、有料スクリプトの購入・使用を推奨しません。コミュニティスクリプトには無料のオープンソースの代替が多数あります。
作者の指示
Pls mail josegejo@gmail.com or contact +91 9846040278
免責事項
この情報および投稿は、TradingViewが提供または推奨する金融、投資、トレード、その他のアドバイスや推奨を意図するものではなく、それらを構成するものでもありません。詳細は利用規約をご覧ください。