OPEN-SOURCE SCRIPT
更新済 Webby's RSI (Really Simple Indicator) [LevelUp]
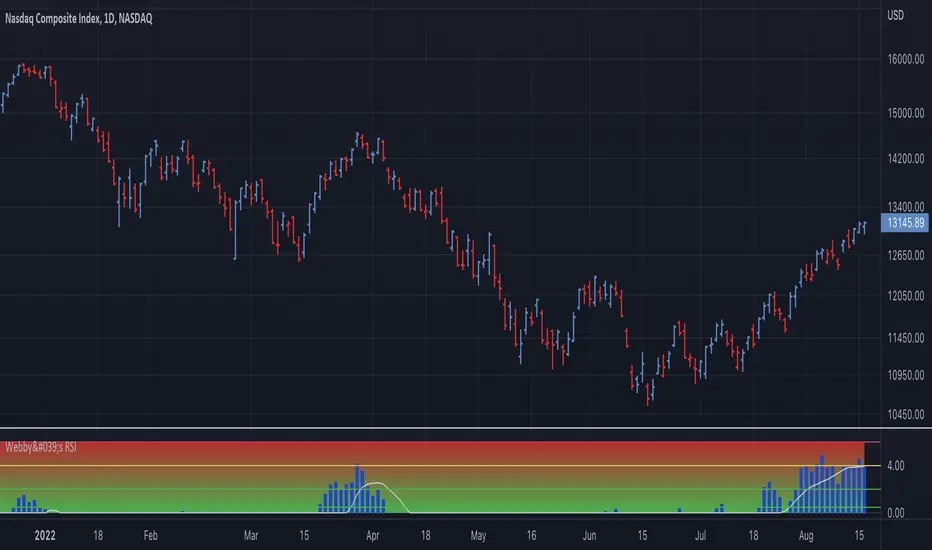
Webby's RSI (Really Simple Indicator) is a technical indicator designed to gauge the health of an uptrend. The concept and original implementation was created by Mike Webster, previously a portfolio manager for William O'Neil, founder of Investor's Business Daily.
Most often used with the Nasdaq Composite (IXIC), Webby's RSI is the percentage of the low versus the 21-day moving average. At the beginning of a bull market, the higher the value, the better, as we want to see power.
Using the zones shown on the chart:
0.5% and 2.0% - Ideal
2.0% to 4.0% - Caution
4.0%+ - Warning
リリースノート
Version 2.0▪ Optional background color shown as a gradient.
▪ Customize plot type, color & moving average.
▪ Show/hide zone lines.
オープンソーススクリプト
TradingViewの精神に則り、このスクリプトの作者はコードをオープンソースとして公開してくれました。トレーダーが内容を確認・検証できるようにという配慮です。作者に拍手を送りましょう!無料で利用できますが、コードの再公開はハウスルールに従う必要があります。
Join traders in over 40 countries and LevelUp!
tradingview.com/spaces/LevelUpTools/
tradingview.com/spaces/LevelUpTools/
免責事項
この情報および投稿は、TradingViewが提供または推奨する金融、投資、トレード、その他のアドバイスや推奨を意図するものではなく、それらを構成するものでもありません。詳細は利用規約をご覧ください。