OPEN-SOURCE SCRIPT
更新済 Average Daily Pip Ranges by month
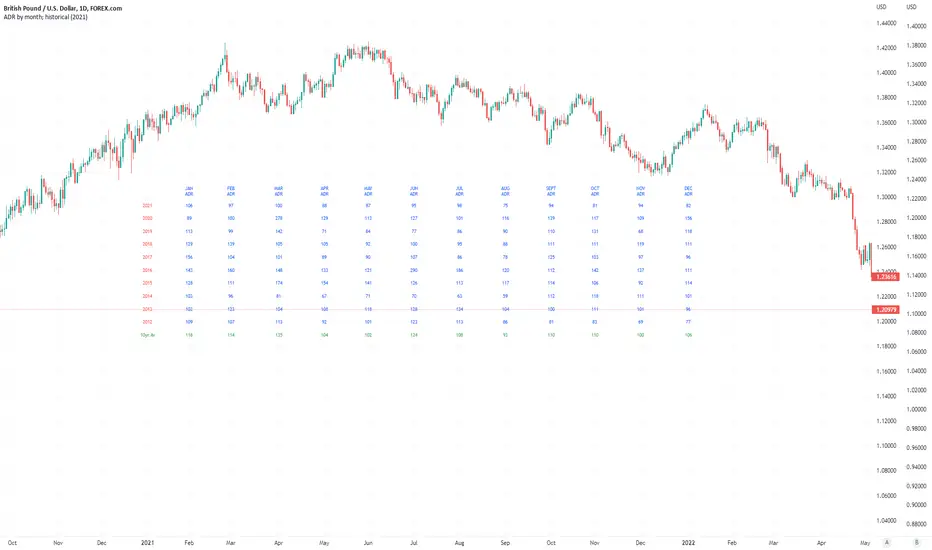
Shows historical average daily pip ranges for specific months for FOREX pairs
useful for guaging typical seasonal volatility; or rough expected daily pip ranges for different months
works on both DXY and foreign currencies
option to plot 10yrs worth of data; with 10yr average of the average daily range for specific months
cast back to any previous 10yrs of your choosing
twingall
リリースノート
Added precision (decimal places) option. Added support for BTC, ETH, S&P, NASDAQ. Added option for user to input multiplier when the asset is not defined. Added Tooltip.リリースノート
Updates:-Using Tables for neater display; user options for text size, color and table position.
-Option for custom number of lookback years to display(0-10).
-Option to show 10yr averages or not (10yrs back from the input start year).
-Added averaging function to account for NaN values: if current month of start year has not yet elapsed, 9yr average will be displayed, otherwise 10yr average.
オープンソーススクリプト
TradingViewの精神に則り、このスクリプトの作者はコードをオープンソースとして公開してくれました。トレーダーが内容を確認・検証できるようにという配慮です。作者に拍手を送りましょう!無料で利用できますが、コードの再公開はハウスルールに従う必要があります。
You can buy me a coffee here...
PayPal.Me/twingall
BTC: 3JrhUwNRnKyqhaa1n1AXKeAubNeEFoch6S
ETH erc20: 0x4b0400B1c18503529ab69611e82a934DDe4Ab038
ETH bep20: 0x1F0f03F184079bb1085F8C9dF3a8191C9f5869B3
PayPal.Me/twingall
BTC: 3JrhUwNRnKyqhaa1n1AXKeAubNeEFoch6S
ETH erc20: 0x4b0400B1c18503529ab69611e82a934DDe4Ab038
ETH bep20: 0x1F0f03F184079bb1085F8C9dF3a8191C9f5869B3
免責事項
この情報および投稿は、TradingViewが提供または推奨する金融、投資、トレード、その他のアドバイスや推奨を意図するものではなく、それらを構成するものでもありません。詳細は利用規約をご覧ください。