OPEN-SOURCE SCRIPT
更新済 Close Price Percentile
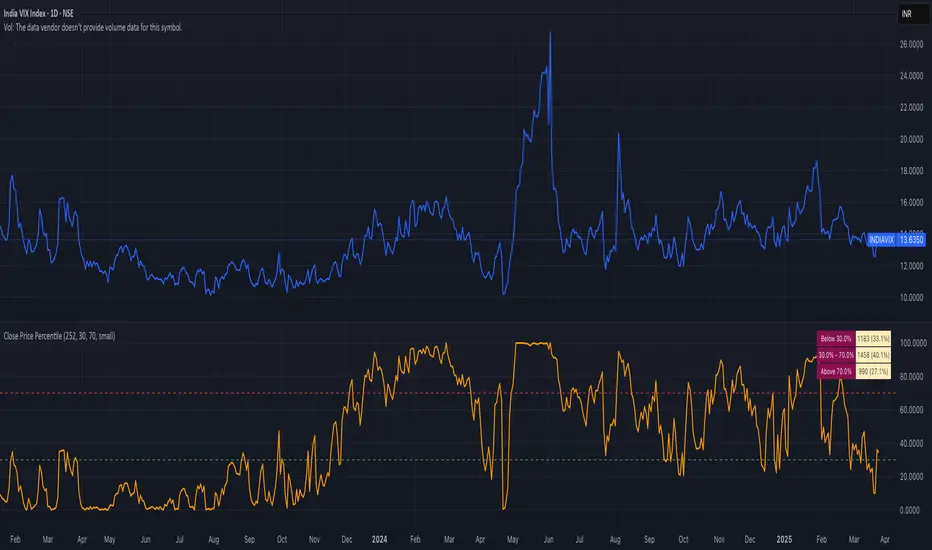
Close Price Percentile with Range Distribution
This indicator helps traders identify where the current price stands relative to its historical context using percentile ranking. It calculates and displays the current price's percentile position within a customizable lookback window (default: 365 periods).
Key Features:
• Percentile Ranking: Shows where the current price falls within its historical range (0-100%)
• Customizable Thresholds: Set your own high/low percentile boundaries for analysis
• Statistical Distribution: Tracks and displays the number and percentage of data points falling in each range (below threshold, between thresholds, above threshold)
• Visual References: Includes dashed lines at threshold levels for easy visual reference
• Clean Data Presentation: Organized table display in the top-right corner
Perfect for:
• Understanding price extremes
• Identifying potential overbought/oversold conditions
• Statistical analysis of price movements
• Mean reversion strategies
Fully customizable with adjustable window length, thresholds, and visual settings.
リリースノート
Close Price Percentile with Range DistributionThis indicator helps traders identify where the current price stands relative to its historical context using percentile ranking. It calculates and displays the current price's percentile position within a customizable lookback window (default: 365 periods).
Key Features:
• Percentile Ranking: Shows where the current price falls within its historical range (0-100%)
• Customizable Thresholds: Set your own high/low percentile boundaries for analysis
• Statistical Distribution: Tracks and displays the number and percentage of data points falling in each range (below threshold, between thresholds, above threshold)
• Visual References: Includes dashed lines at threshold levels for easy visual reference
• Clean Data Presentation: Organized table display in the top-right corner
Perfect for:
• Understanding price extremes
• Identifying potential overbought/oversold conditions
• Statistical analysis of price movements
• Mean reversion strategies
Fully customizable with adjustable window length, thresholds, and visual settings.
オープンソーススクリプト
TradingViewの精神に則り、このスクリプトの作者はコードをオープンソースとして公開してくれました。トレーダーが内容を確認・検証できるようにという配慮です。作者に拍手を送りましょう!無料で利用できますが、コードの再公開はハウスルールに従う必要があります。
免責事項
この情報および投稿は、TradingViewが提供または推奨する金融、投資、トレード、その他のアドバイスや推奨を意図するものではなく、それらを構成するものでもありません。詳細は利用規約をご覧ください。
オープンソーススクリプト
TradingViewの精神に則り、このスクリプトの作者はコードをオープンソースとして公開してくれました。トレーダーが内容を確認・検証できるようにという配慮です。作者に拍手を送りましょう!無料で利用できますが、コードの再公開はハウスルールに従う必要があります。
免責事項
この情報および投稿は、TradingViewが提供または推奨する金融、投資、トレード、その他のアドバイスや推奨を意図するものではなく、それらを構成するものでもありません。詳細は利用規約をご覧ください。