OPEN-SOURCE SCRIPT
NSDT Auto Fib Support / Resistance Levels
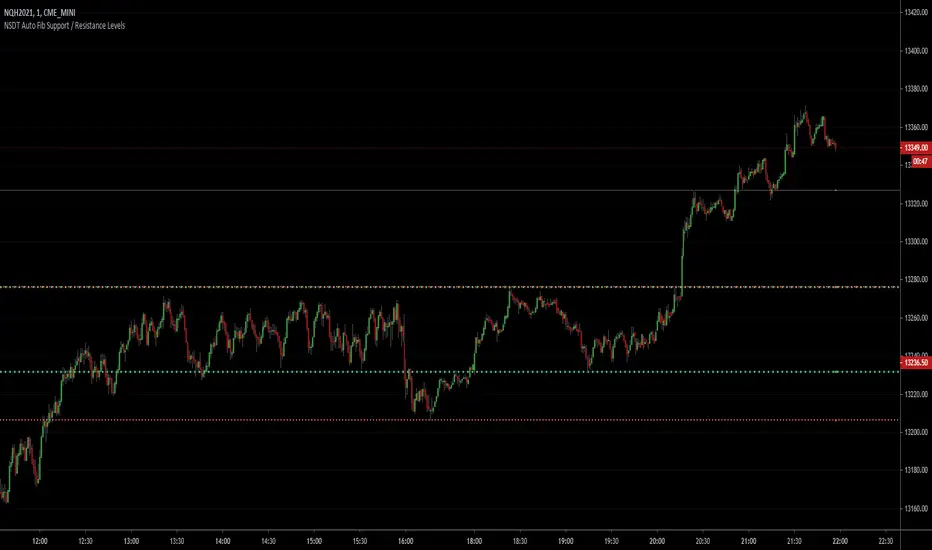
This script automatically plots support and resistance lines using the fib numbers as the amount of candles to lookback. Each line is colored differently to easily identify the support/resistance pair (i.e. 23%, 38%, 61%, etc..) with the 50% (Green) and 78% (Red) a thicker line. All variables are editable. Added alert capability.
オープンソーススクリプト
TradingViewの精神に則り、このスクリプトの作者はコードをオープンソースとして公開してくれました。トレーダーが内容を確認・検証できるようにという配慮です。作者に拍手を送りましょう!無料で利用できますが、コードの再公開はハウスルールに従う必要があります。
ALL indicators, strategies and bots are included with Discord access.
NorthStarDayTrading.com/discord
youtube.com/shorts/fWFQE7uEHvU
NorthStarDayTrading.com/discord
youtube.com/shorts/fWFQE7uEHvU
免責事項
この情報および投稿は、TradingViewが提供または推奨する金融、投資、トレード、その他のアドバイスや推奨を意図するものではなく、それらを構成するものでもありません。詳細は利用規約をご覧ください。