OPEN-SOURCE SCRIPT
Trend-reversal
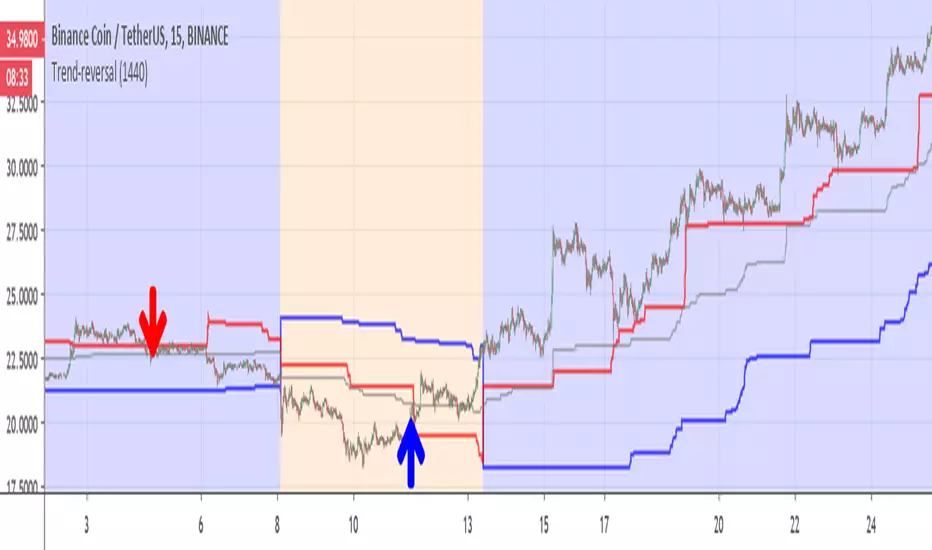
This indicator is for detection of trend reversal based on trailing stop (blue line)
the Bullish zone is in blue (red above blue line), bearish zone in orange ( blue line above red line)
gray line is the average of donchian channel
I put the line on 1440 min (so it like daily trailing line) , you can make it shorter if you want .
In this example of BNB coin we see in red arrow that the coin drop from red line so it loosing power -here it sell point during bullish period(blue)
on the other hand when we are in bearish (orange), we can see that the coin is breaking the red line -buy point and the trend is reverse
main script is taken from ceyhun so credit is to him on this
オープンソーススクリプト
TradingViewの精神に則り、このスクリプトの作者はコードをオープンソースとして公開してくれました。トレーダーが内容を確認・検証できるようにという配慮です。作者に拍手を送りましょう!無料で利用できますが、コードの再公開はハウスルールに従う必要があります。
免責事項
この情報および投稿は、TradingViewが提供または推奨する金融、投資、トレード、その他のアドバイスや推奨を意図するものではなく、それらを構成するものでもありません。詳細は利用規約をご覧ください。
オープンソーススクリプト
TradingViewの精神に則り、このスクリプトの作者はコードをオープンソースとして公開してくれました。トレーダーが内容を確認・検証できるようにという配慮です。作者に拍手を送りましょう!無料で利用できますが、コードの再公開はハウスルールに従う必要があります。
免責事項
この情報および投稿は、TradingViewが提供または推奨する金融、投資、トレード、その他のアドバイスや推奨を意図するものではなく、それらを構成するものでもありません。詳細は利用規約をご覧ください。