OPEN-SOURCE SCRIPT
更新済 Cox Algo - Trend Pullback Signals (Buy / Hold / Sell)
What This Indicator Does
This script identifies strong trend continuation trades after a healthy pullback. It filters out weak or choppy market conditions and highlights only the most structurally sound setups based on:
1. Trend Direction
• Fast EMA (21) vs Slow EMA (50)
• If Fast EMA > Slow EMA → Uptrend
• If Fast EMA < Slow EMA → Downtrend
2. Higher Timeframe Confirmation (optional)
Checks trend alignment using a higher timeframe EMA pair (e.g., 1H → 4H trend).
3. Trend Strength (ADX)
Signals only fire when the ADX trend strength filter is above the threshold (default 15) to avoid sideways chop.
4. RSI Pullback Logic
Signals are triggered when price pulls back against the trend and RSI recovers in the direction of the dominant trend.
⸻
🎯 Signals
BUY
• Trend is bullish
• ADX strong
• RSI recovers from oversold
• Price reclaims Fast EMA
• BUY triangle appears below the bar
• Bar turns green
SELL
• Trend is bearish
• ADX strong
• RSI drops from overbought
• Price loses Fast EMA
• SELL triangle appears above the bar
• Bar turns red
HOLD
• No new signal
• Bar turns gray
• Maintains current market bias
(until a new BUY or SELL triggers)
⸻
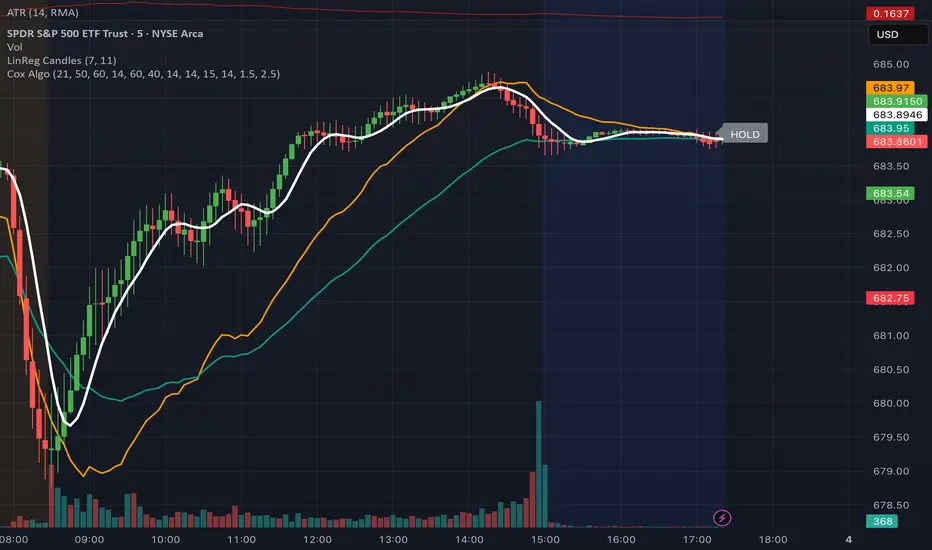
📊 Visuals
• Green bars → BUY condition
• Red bars → SELL condition
• Gray bars → HOLD / no signal
• Yellow line = Fast EMA (short-term trend)
• Green line = Slow EMA (macro trend)
• Optional HTF background shading to visualize higher-timeframe direction.
⸻
🔔 Alerts Included
• Buy Signal
• Sell Signal
Set alerts to “Once Per Bar Close” for clean, non-noisy entries.
⸻
🚀 Best Use Cases
• Trend continuation trades
• Swing trading
• Intraday pullback entries
• Filtering out false breakouts
• Following strong directional momentum
• Avoiding choppy markets
Works well on:
• Indices (SPY, QQQ, NAS100)
• Strong trending stocks (NVDA, AAPL, SMH)
• Crypto
• Forex pairs
This script identifies strong trend continuation trades after a healthy pullback. It filters out weak or choppy market conditions and highlights only the most structurally sound setups based on:
1. Trend Direction
• Fast EMA (21) vs Slow EMA (50)
• If Fast EMA > Slow EMA → Uptrend
• If Fast EMA < Slow EMA → Downtrend
2. Higher Timeframe Confirmation (optional)
Checks trend alignment using a higher timeframe EMA pair (e.g., 1H → 4H trend).
3. Trend Strength (ADX)
Signals only fire when the ADX trend strength filter is above the threshold (default 15) to avoid sideways chop.
4. RSI Pullback Logic
Signals are triggered when price pulls back against the trend and RSI recovers in the direction of the dominant trend.
⸻
🎯 Signals
BUY
• Trend is bullish
• ADX strong
• RSI recovers from oversold
• Price reclaims Fast EMA
• BUY triangle appears below the bar
• Bar turns green
SELL
• Trend is bearish
• ADX strong
• RSI drops from overbought
• Price loses Fast EMA
• SELL triangle appears above the bar
• Bar turns red
HOLD
• No new signal
• Bar turns gray
• Maintains current market bias
(until a new BUY or SELL triggers)
⸻
📊 Visuals
• Green bars → BUY condition
• Red bars → SELL condition
• Gray bars → HOLD / no signal
• Yellow line = Fast EMA (short-term trend)
• Green line = Slow EMA (macro trend)
• Optional HTF background shading to visualize higher-timeframe direction.
⸻
🔔 Alerts Included
• Buy Signal
• Sell Signal
Set alerts to “Once Per Bar Close” for clean, non-noisy entries.
⸻
🚀 Best Use Cases
• Trend continuation trades
• Swing trading
• Intraday pullback entries
• Filtering out false breakouts
• Following strong directional momentum
• Avoiding choppy markets
Works well on:
• Indices (SPY, QQQ, NAS100)
• Strong trending stocks (NVDA, AAPL, SMH)
• Crypto
• Forex pairs
リリースノート
A trend-continuation trading model that identifies high-probability buy and sell opportunities after controlled pullbacks inside a strong trend. The indicator uses multi-confirmation logic (EMAs + RSI + ADX + optional higher-timeframe trend filter) to generate clean, non-repainting signals and provide clear market state guidance.⸻
✅ How It Works
This system detects moments where price temporarily pulls back against the underlying trend and then snaps back in the trend direction — one of the most reliable trade setups across all markets.
The script evaluates:
1. Trend Direction
Using two EMAs:
• Fast EMA (default 21)
• Slow EMA (default 50)
Fast EMA above Slow EMA → Uptrend
Fast EMA below Slow EMA → Downtrend
2. Higher-Timeframe Confirmation (optional)
You can require the higher timeframe (e.g., 1H → 4H) to agree with the trend for added reliability.
3. Trend Strength (ADX)
Signals only appear when ADX is above the minimum threshold, filtering out low-volatility chop.
4. RSI Pullback Structure
Signals are triggered when RSI:
• In uptrends → dips below oversold level then crosses back up
• In downtrends → pushes above overbought level then crosses back down
This confirms a healthy pullback and momentum resumption.
⸻
🎯 Signals
The script produces three states:
BUY
• Trend is bullish
• ADX strong
• RSI pulls back then recovers
• Price closes back above Fast EMA
• Green bar and BUY label printed at the bar’s close
SELL
• Trend is bearish
• ADX strong
• RSI pulls back then breaks downward
• Price closes below Fast EMA
• Red bar and SELL label
HOLD / NEUTRAL
• No signal present
• Gray bar
• A HOLD label appears on the latest bar
⸻
📊 Visuals
• Green bars = Buy bias
• Red bars = Sell bias
• Gray bars = Neutral / Hold
• One clean BUY / SELL / HOLD label on the most recent bar
• Trend EMAs displayed (21 & 50)
• Optional ATR-based stop/target lines
Everything is plotted directly on the chart for maximum clarity.
⸻
🔔 Alerts Included
You can set alerts for:
• Buy Signal
• Sell Signal
Use “Once per bar close” for the cleanest, non-repainting alerts.
⸻
⚡ Best For
• Trend-following traders
• Swing trading
• Intraday trend playbooks
• Crypto, stocks, indices, and Forex
• Avoiding choppy/no-trend periods
オープンソーススクリプト
TradingViewの精神に則り、このスクリプトの作者はコードをオープンソースとして公開してくれました。トレーダーが内容を確認・検証できるようにという配慮です。作者に拍手を送りましょう!無料で利用できますが、コードの再公開はハウスルールに従う必要があります。
免責事項
この情報および投稿は、TradingViewが提供または推奨する金融、投資、トレード、その他のアドバイスや推奨を意図するものではなく、それらを構成するものでもありません。詳細は利用規約をご覧ください。
オープンソーススクリプト
TradingViewの精神に則り、このスクリプトの作者はコードをオープンソースとして公開してくれました。トレーダーが内容を確認・検証できるようにという配慮です。作者に拍手を送りましょう!無料で利用できますが、コードの再公開はハウスルールに従う必要があります。
免責事項
この情報および投稿は、TradingViewが提供または推奨する金融、投資、トレード、その他のアドバイスや推奨を意図するものではなく、それらを構成するものでもありません。詳細は利用規約をご覧ください。