OPEN-SOURCE SCRIPT
Moving Averages Trend Indicator
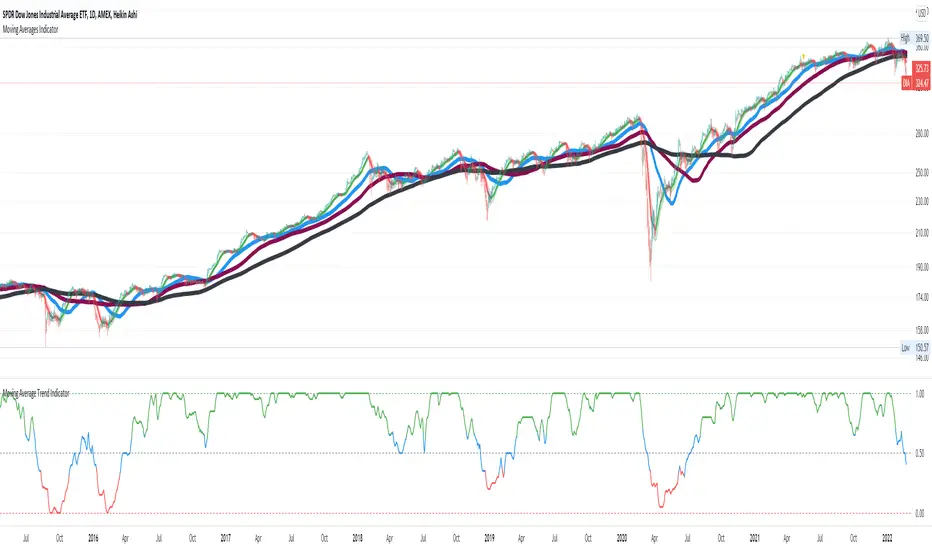
Computes a metric (0.0-1.0) based on the relative (above/below) relationship of price (close) and the moving averages of WMA0 (20day), SMA1 (50day), SMA2 (100day), SMA3 (200day).
Metric = 1.0 when price > SMA0 > SMA1 > SMA2 > SMA3
Metric = 0.0 when price < SMA0 < SMA1 < SMA2 < SMA3
This metric helps you track the price "trend." Color of the metric helps you track if the price is a bullish (green) or bearish (red). Blue indicates neutral.
Settings:
- Time Frame is adjustable
- SMA lengths are adjustable
- Threshold for bullish/bearish is adjustable
オープンソーススクリプト
TradingViewの精神に則り、このスクリプトの作者はコードをオープンソースとして公開してくれました。トレーダーが内容を確認・検証できるようにという配慮です。作者に拍手を送りましょう!無料で利用できますが、コードの再公開はハウスルールに従う必要があります。
免責事項
この情報および投稿は、TradingViewが提供または推奨する金融、投資、トレード、その他のアドバイスや推奨を意図するものではなく、それらを構成するものでもありません。詳細は利用規約をご覧ください。
オープンソーススクリプト
TradingViewの精神に則り、このスクリプトの作者はコードをオープンソースとして公開してくれました。トレーダーが内容を確認・検証できるようにという配慮です。作者に拍手を送りましょう!無料で利用できますが、コードの再公開はハウスルールに従う必要があります。
免責事項
この情報および投稿は、TradingViewが提供または推奨する金融、投資、トレード、その他のアドバイスや推奨を意図するものではなく、それらを構成するものでもありません。詳細は利用規約をご覧ください。