OPEN-SOURCE SCRIPT
RSI Overbought/Oversold MTF
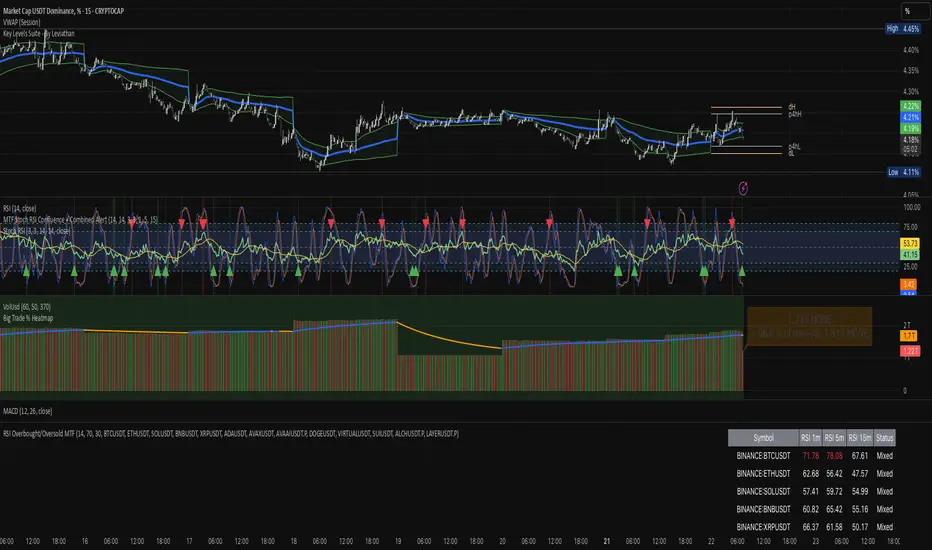
RSI Overbought / Oversold MTF — Dashboard & Alerts
What it does
This script scans up to 13 symbols at once and shows their RSI readings on three lower‑time‑frames (1 min, 5 min, 15 min).
If all three RSIs for a symbol are simultaneously above the overbought threshold or below the oversold threshold, the script:
Prints the condition (“Overbought” / “Oversold”) in a color‑coded dashboard table.
Fires a one‑per‑bar alert so you never miss the move.
Key features
Feature Details
Multi‑symbol Default list includes BTC, ETH, SOL, BNB, XRP, ADA, AVAX, AVAAI, DOGE, VIRTUAL, SUI, ALCH, LAYER (all Binance pairs). Replace or reorder in the inputs.
Triple‑time‑frame check RSI is calculated on 1 m, 5 m, 15 m for each symbol.
Customizable thresholds Set your own RSI Period, Overbought and Oversold levels. Defaults: 14 / 70 / 30.
Color‑coded dashboard Top‑right table shows:
• Symbol name
• RSI 1 m / 5 m / 15 m (red = overbought, green = oversold, white = neutral)
• Overall Status column (“Overbought”, “Oversold”, “Mixed”).
Alerts built in Triggers once per bar whenever a symbol is overbought or oversold on all three time‑frames simultaneously.
Typical use cases
Scalp alignment — Enter when all short TFs agree on overbought/oversold extremes.
Mean‑reversion spotting — Identify stretched conditions across multiple coins without switching charts.
Quick sentiment scan — Glance at the dashboard to see where momentum is heating up or cooling down.
How to use
Add to chart (overlay = false; it sits in its own pane).
Adjust symbols & thresholds in the Settings panel.
Create alerts → choose “RSI Overbought/Oversold MTF” → “Any Alert() Function Call” to receive push, email, or webhook notifications.
Note: The script queries many symbols each bar; use on lower time‑frames only if your data limits allow.
For educational purposes only — not financial advice. Always test on paper before trading live.
オープンソーススクリプト
TradingViewの精神に則り、このスクリプトの作者はコードをオープンソースとして公開してくれました。トレーダーが内容を確認・検証できるようにという配慮です。作者に拍手を送りましょう!無料で利用できますが、コードの再公開はハウスルールに従う必要があります。
免責事項
この情報および投稿は、TradingViewが提供または推奨する金融、投資、トレード、その他のアドバイスや推奨を意図するものではなく、それらを構成するものでもありません。詳細は利用規約をご覧ください。
オープンソーススクリプト
TradingViewの精神に則り、このスクリプトの作者はコードをオープンソースとして公開してくれました。トレーダーが内容を確認・検証できるようにという配慮です。作者に拍手を送りましょう!無料で利用できますが、コードの再公開はハウスルールに従う必要があります。
免責事項
この情報および投稿は、TradingViewが提供または推奨する金融、投資、トレード、その他のアドバイスや推奨を意図するものではなく、それらを構成するものでもありません。詳細は利用規約をご覧ください。