OPEN-SOURCE SCRIPT
Revolution Kagi Reversal Amount Indicator
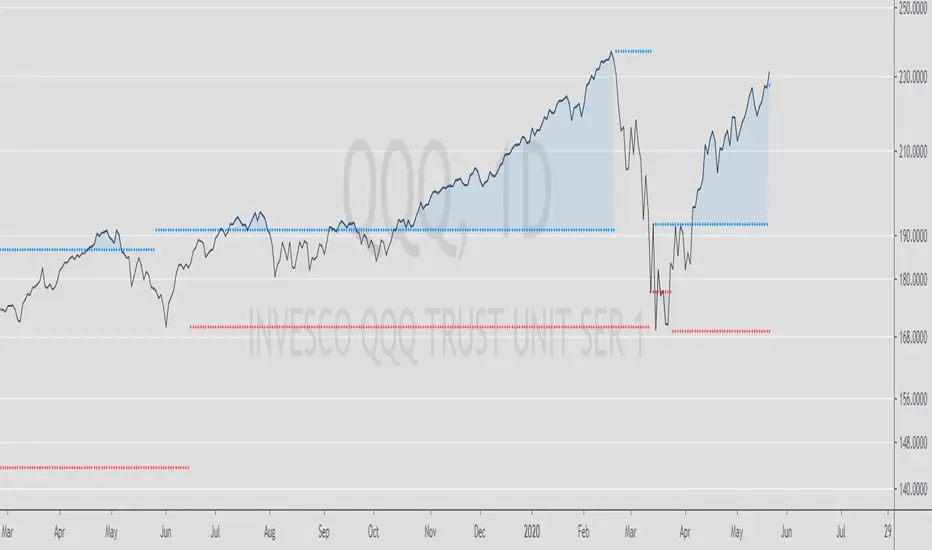
This is one of my favorite indicators. You simply type in the significant price levels for whatever asset you are trading and it will plot pivots accordingly. As in title, the indicator is based on the fantastic Kagi reversal indicator.
For instance, if, say, brent crude oil is trading at $60, you can assume that $10 and $5 will be significant price levels. If gold is trading at $1500, $100 and $500 might be significant and so on.
For instance, if, say, brent crude oil is trading at $60, you can assume that $10 and $5 will be significant price levels. If gold is trading at $1500, $100 and $500 might be significant and so on.
オープンソーススクリプト
TradingViewの精神に則り、このスクリプトの作者はコードをオープンソースとして公開してくれました。トレーダーが内容を確認・検証できるようにという配慮です。作者に拍手を送りましょう!無料で利用できますが、コードの再公開はハウスルールに従う必要があります。
免責事項
この情報および投稿は、TradingViewが提供または推奨する金融、投資、トレード、その他のアドバイスや推奨を意図するものではなく、それらを構成するものでもありません。詳細は利用規約をご覧ください。
オープンソーススクリプト
TradingViewの精神に則り、このスクリプトの作者はコードをオープンソースとして公開してくれました。トレーダーが内容を確認・検証できるようにという配慮です。作者に拍手を送りましょう!無料で利用できますが、コードの再公開はハウスルールに従う必要があります。
免責事項
この情報および投稿は、TradingViewが提供または推奨する金融、投資、トレード、その他のアドバイスや推奨を意図するものではなく、それらを構成するものでもありません。詳細は利用規約をご覧ください。