OPEN-SOURCE SCRIPT
Bull Bear Bars
Highlights when the movement of a candle is supported by a major increase in volume. Thus one could reasonably assume that a follow thru is likely to occur.
Blue= bullish
Yellow = bearish
I personally use this as an entry system. I enter only if the blue high or yellow low is surpassed by the very next candle , if not, then i do not enter. Thus trading with momentum and greatly avoiding choppy market conditions.
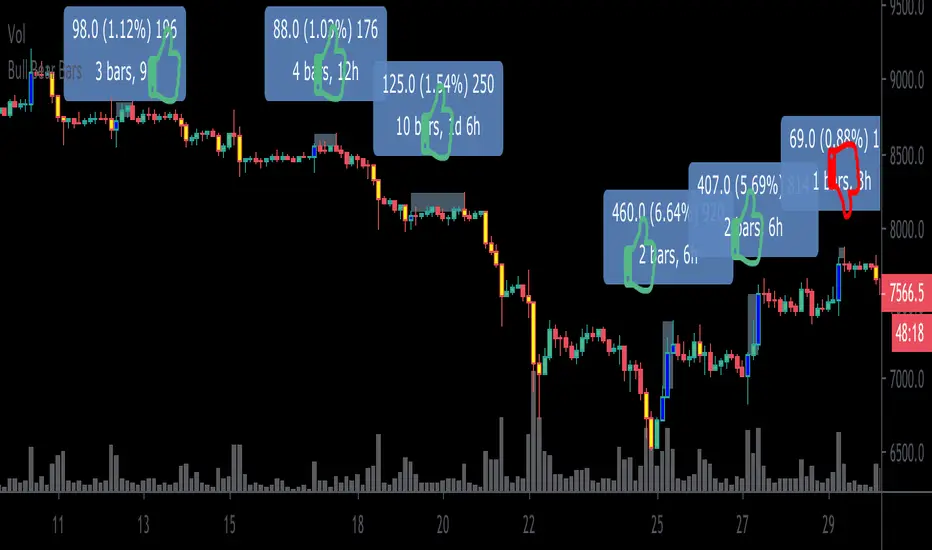
***Example*** In the chart above, during XBT’s month long November 2019 Downtrend.. I am showing my bull long entries (without showing the obvious winning bear entries!) and found that only once did the price fail to advance less than 1% before any significant drawdown occurs (As shown on the chart by thumbs up & thumbs down symbols.)
***When using this indicator it is important to keep in mind that Blue bullish bars can and will appear at the top of upswings likewise, yellow bearish bars can and will appear at the bottom of downswings.. which could potentially signify trend reversals.
This knowledge can also can be used to ones advantage (” buy when everyone is selling, sell when everyone is buying.”)
This is a common occurrence because retail traders are often late to the party before they catch on to a trend resulting in buying heavily at the top and selling heavily at the bottom providing liquidity to earlier entrants to exit and as per usual the price then reverses on the mass of late bloomers.***
This indicator can be used in many different ways so goodluck in finding the method that best suits your style and be careful out there. Cheers
BONUS: Also has the ability to set alerts!
Blue= bullish
Yellow = bearish
I personally use this as an entry system. I enter only if the blue high or yellow low is surpassed by the very next candle , if not, then i do not enter. Thus trading with momentum and greatly avoiding choppy market conditions.
***Example*** In the chart above, during
***When using this indicator it is important to keep in mind that Blue bullish bars can and will appear at the top of upswings likewise, yellow bearish bars can and will appear at the bottom of downswings.. which could potentially signify trend reversals.
This knowledge can also can be used to ones advantage (” buy when everyone is selling, sell when everyone is buying.”)
This is a common occurrence because retail traders are often late to the party before they catch on to a trend resulting in buying heavily at the top and selling heavily at the bottom providing liquidity to earlier entrants to exit and as per usual the price then reverses on the mass of late bloomers.***
This indicator can be used in many different ways so goodluck in finding the method that best suits your style and be careful out there. Cheers
BONUS: Also has the ability to set alerts!
オープンソーススクリプト
TradingViewの精神に則り、このスクリプトの作者はコードをオープンソースとして公開してくれました。トレーダーが内容を確認・検証できるようにという配慮です。作者に拍手を送りましょう!無料で利用できますが、コードの再公開はハウスルールに従う必要があります。
免責事項
この情報および投稿は、TradingViewが提供または推奨する金融、投資、トレード、その他のアドバイスや推奨を意図するものではなく、それらを構成するものでもありません。詳細は利用規約をご覧ください。
オープンソーススクリプト
TradingViewの精神に則り、このスクリプトの作者はコードをオープンソースとして公開してくれました。トレーダーが内容を確認・検証できるようにという配慮です。作者に拍手を送りましょう!無料で利用できますが、コードの再公開はハウスルールに従う必要があります。
免責事項
この情報および投稿は、TradingViewが提供または推奨する金融、投資、トレード、その他のアドバイスや推奨を意図するものではなく、それらを構成するものでもありません。詳細は利用規約をご覧ください。