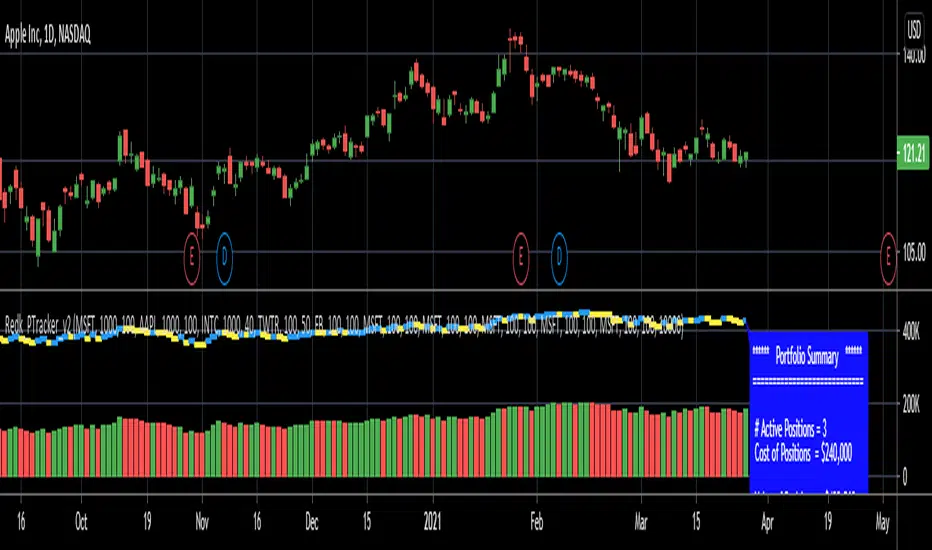
This is an update for the PTracker v1 that I published couple of days ago. wanted to publish this as a separate script to get a chance to show how the new Portfolio Summary Infobox can be displayed on the price chart as an option. In my opinion, that info box is the most important element in this tool and that's the piece i was most looking for.
quick note here: you can track your portfolio (if not so many positions) by entering something like [MSFT * 1000 + AAPL * 1000 + INTC * 2000 ] (without the brackets) in TradingView's chart symbol area - TradingView will resolve these symbols and chart the total -- there's a nice post by our friend boji1 about this in a lot more details - however, that wouldn't show the stats that i need to look at to track my portfolio on daily basis.
i also made couple of other enhancements, like adding the ability to include "free cash" in the portfolio - While this free cash value will impact the Total P/L and P/L %, as part of the overall portfolio (and the denominator), it will not impact the "cost of positions" or the (current) "value of positions" -- also "Cash" will not count towards the total 10 positions that we can track with this tool.
Using Portfolio Tracker as a floating panel on the price chart
====================================================
here's a screenshot that shows this scenario - also shows how the infobox color can be easily changed from the PTracker settings to suit your chart background and for best visibility

i hope this is useful in your trading - i look forward to TradingView team surprising us with a real portfolio tracking capability soon :)
good luck.
quick note here: you can track your portfolio (if not so many positions) by entering something like [MSFT * 1000 + AAPL * 1000 + INTC * 2000 ] (without the brackets) in TradingView's chart symbol area - TradingView will resolve these symbols and chart the total -- there's a nice post by our friend boji1 about this in a lot more details - however, that wouldn't show the stats that i need to look at to track my portfolio on daily basis.
i also made couple of other enhancements, like adding the ability to include "free cash" in the portfolio - While this free cash value will impact the Total P/L and P/L %, as part of the overall portfolio (and the denominator), it will not impact the "cost of positions" or the (current) "value of positions" -- also "Cash" will not count towards the total 10 positions that we can track with this tool.
Using Portfolio Tracker as a floating panel on the price chart
====================================================
- By default, when the Portfolio Tracker is added to the chart, it will occupy its own lower panel like the picture above.
- if your charts are already busy (like mine :)) - you most probably already have a couple of lower studies and it's crowded there.
- in this case, you can use the Object Tree tool after adding the PTracker, to drag it onto the price panel, or you can also do that by right-clicking on the infobox and choose to move up to the price panel.
- when you do that, remember to also use the Style settings of PTracker to hide both Portfolio and PnL plots, and choose Scale = no scale - this way you get the infobox to work like a floating panel on the price chart
here's a screenshot that shows this scenario - also shows how the infobox color can be easily changed from the PTracker settings to suit your chart background and for best visibility
i hope this is useful in your trading - i look forward to TradingView team surprising us with a real portfolio tracking capability soon :)
good luck.
オープンソーススクリプト
TradingViewの精神に則り、このスクリプトの作者はコードをオープンソースとして公開してくれました。トレーダーが内容を確認・検証できるようにという配慮です。作者に拍手を送りましょう!無料で利用できますが、コードの再公開はハウスルールに従う必要があります。
免責事項
この情報および投稿は、TradingViewが提供または推奨する金融、投資、トレード、その他のアドバイスや推奨を意図するものではなく、それらを構成するものでもありません。詳細は利用規約をご覧ください。
オープンソーススクリプト
TradingViewの精神に則り、このスクリプトの作者はコードをオープンソースとして公開してくれました。トレーダーが内容を確認・検証できるようにという配慮です。作者に拍手を送りましょう!無料で利用できますが、コードの再公開はハウスルールに従う必要があります。
免責事項
この情報および投稿は、TradingViewが提供または推奨する金融、投資、トレード、その他のアドバイスや推奨を意図するものではなく、それらを構成するものでもありません。詳細は利用規約をご覧ください。
