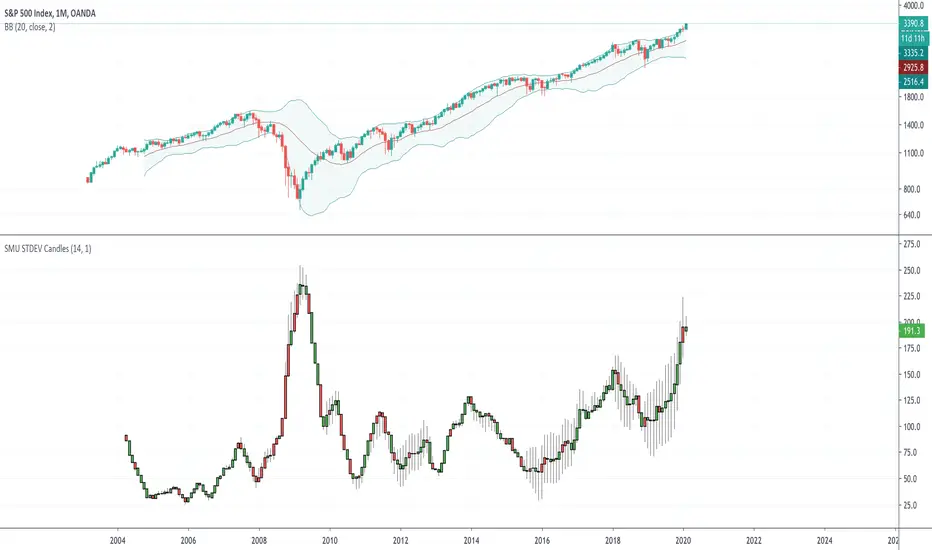
This script creates a STDEV in a candle format so you can see the Change in a candle format and compare it with the actual price candle.
Is very similar to SMU RSI and SMU ROC. The interesting part is to see the full effect of traditional indicators in a candle format rather than a simple plot format. Very interesting view in SPX. There is a very big clue in the chart as STDEV changed since 2008. Can you figure it out?
Also, try this in lower time frame and you will be amazed how Algo kills volatility after each upside or downside. Fascinating
オープンソーススクリプト
TradingViewの精神に則り、このスクリプトの作者はコードをオープンソースとして公開してくれました。トレーダーが内容を確認・検証できるようにという配慮です。作者に拍手を送りましょう!無料で利用できますが、コードの再公開はハウスルールに従う必要があります。
免責事項
この情報および投稿は、TradingViewが提供または推奨する金融、投資、トレード、その他のアドバイスや推奨を意図するものではなく、それらを構成するものでもありません。詳細は利用規約をご覧ください。
オープンソーススクリプト
TradingViewの精神に則り、このスクリプトの作者はコードをオープンソースとして公開してくれました。トレーダーが内容を確認・検証できるようにという配慮です。作者に拍手を送りましょう!無料で利用できますが、コードの再公開はハウスルールに従う必要があります。
免責事項
この情報および投稿は、TradingViewが提供または推奨する金融、投資、トレード、その他のアドバイスや推奨を意図するものではなく、それらを構成するものでもありません。詳細は利用規約をご覧ください。