OPEN-SOURCE SCRIPT
Relative Price Difference [LAVA]
EDIT: Look below for updates to the script.
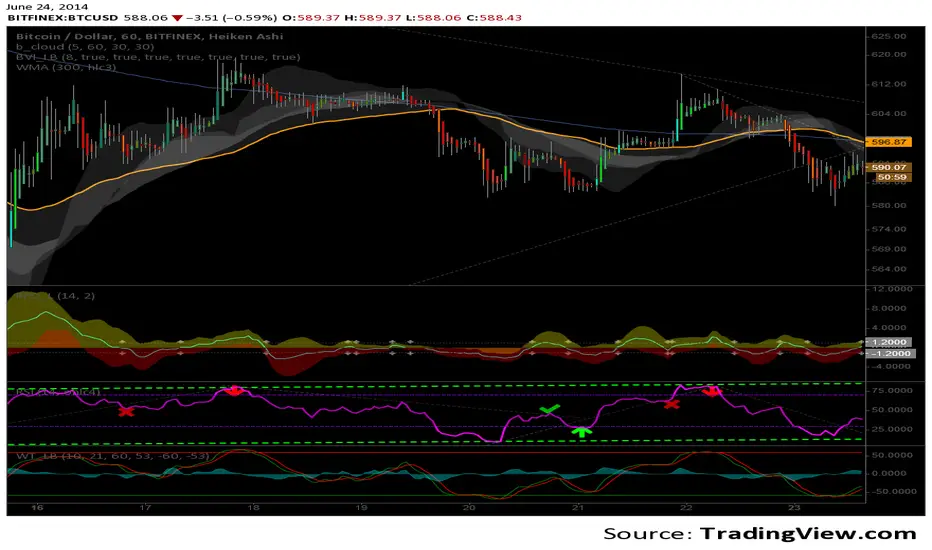
EDIT: After several updates to this script, I think it's safe to say it will work with all timelines. Using hand drawn trendlines, it can predict tops and bottoms with pretty good accuracy.
Shows a change in the relative price difference via percentage on a 0 horizontal. Added a bollinger band to help identify weak areas (orange). If orange starts showing, the current price direction is strong but can reverse harshly. If you are in a weak position, exit here. Otherwise, don't enter a trade after/during orange sessions until a full cycle (up/dn > 1% without orange) has completed. The main line indicator fluctuates according to the price difference. 1% horizontal lines are added to help identify profit taking spots or OTE zones. Ensure the 1% line is crossed completely before you decide to enter/exit. Cross points are identified with crosses if you missed your window, this is the last spot to exit, enter. This indicator doesn't work that well with small time intervals. As always, use more than one indicator to ensure your decision is right. (The colors are ugly so change them if you wish! :)
オープンソーススクリプト
TradingViewの精神に則り、このスクリプトの作者はコードをオープンソースとして公開してくれました。トレーダーが内容を確認・検証できるようにという配慮です。作者に拍手を送りましょう!無料で利用できますが、コードの再公開はハウスルールに従う必要があります。
免責事項
この情報および投稿は、TradingViewが提供または推奨する金融、投資、トレード、その他のアドバイスや推奨を意図するものではなく、それらを構成するものでもありません。詳細は利用規約をご覧ください。
オープンソーススクリプト
TradingViewの精神に則り、このスクリプトの作者はコードをオープンソースとして公開してくれました。トレーダーが内容を確認・検証できるようにという配慮です。作者に拍手を送りましょう!無料で利用できますが、コードの再公開はハウスルールに従う必要があります。
免責事項
この情報および投稿は、TradingViewが提供または推奨する金融、投資、トレード、その他のアドバイスや推奨を意図するものではなく、それらを構成するものでもありません。詳細は利用規約をご覧ください。