OPEN-SOURCE SCRIPT
更新済 Candle Scale Comparison
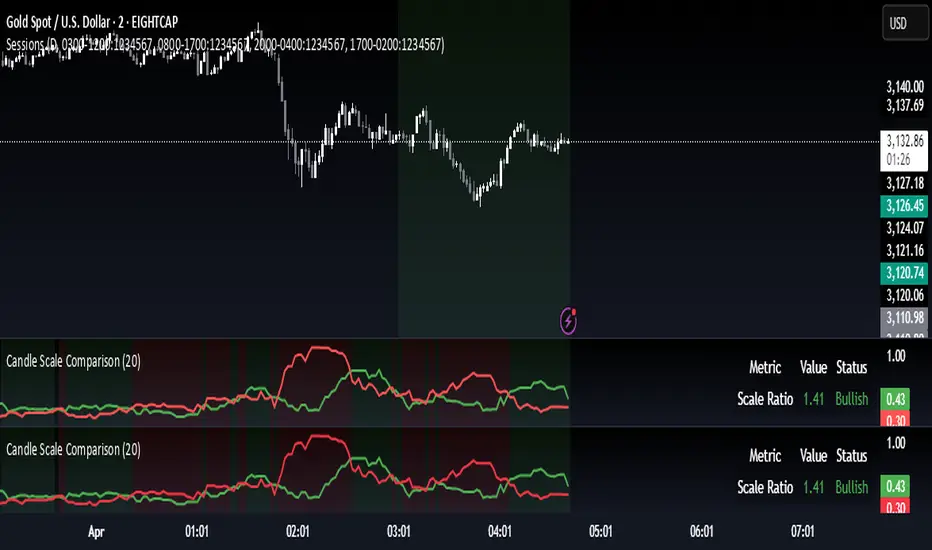
Compares the scale of bullish and bearish candles and shows which side is currently dominant. Works in any symbol.
1. Input Parameters:
- LookbackPeriod: Allows you to set how many bars to look back for calculating averages (default: 20)
- showLabels: Toggle to show/hide dominance labels on the chart
2. Calculations:
- Calculates the scale of bullish candles (close - open)
Calculates the scale of bearish candles (open - close)
- Computes moving averages for both scales using the specified lookback period
- Determines which type of candles are dominating based on the averages
3. Visual Elements:
- Plots two lines showing the average scales:
- Green line for bullish candle scales
- Red line for bearish candle scales
- Adds a background color that changes based on dominance:
- Light green when bullish candles dominate
- Light red when bearish candles dominate
- Shows labels above the chart indicating current dominance
- Displays a table in the top-right corner showing:
- The current scale ratio (bullish/bearish)
- The current dominance status
4. Features:
- The indicator is plotted in a separate pane below the main chart
- Uses color coding for easy visual interpretation
- Provides both visual and numerical representation of the dominance
- Updates in real-time as new candles form
リリースノート
Compares the scale of bullish and bearish candles and shows which side is currently dominant. Works in any symbol.1. Input Parameters:
- LookbackPeriod: Allows you to set how many bars to look back for calculating averages (default: 20)
- showLabels: Toggle to show/hide dominance labels on the chart
2. Calculations:
- Calculates the scale of bullish candles (close - open)
Calculates the scale of bearish candles (open - close)
- Computes moving averages for both scales using the specified lookback period
- Determines which type of candles are dominating based on the averages
3. Visual Elements:
- Plots two lines showing the average scales:
- Green line for bullish candle scales
- Red line for bearish candle scales
- Adds a background color that changes based on dominance:
- Light green when bullish candles dominate
- Light red when bearish candles dominate
- Shows labels above the chart indicating current dominance
- Displays a table in the top-right corner showing:
- The current scale ratio (bullish/bearish)
- The current dominance status
4. Features:
- The indicator is plotted in a separate pane below the main chart
- Uses color coding for easy visual interpretation
- Provides both visual and numerical representation of the dominance
- Updates in real-time as new candles form
オープンソーススクリプト
TradingViewの精神に則り、このスクリプトの作者はコードをオープンソースとして公開してくれました。トレーダーが内容を確認・検証できるようにという配慮です。作者に拍手を送りましょう!無料で利用できますが、コードの再公開はハウスルールに従う必要があります。
免責事項
この情報および投稿は、TradingViewが提供または推奨する金融、投資、トレード、その他のアドバイスや推奨を意図するものではなく、それらを構成するものでもありません。詳細は利用規約をご覧ください。
オープンソーススクリプト
TradingViewの精神に則り、このスクリプトの作者はコードをオープンソースとして公開してくれました。トレーダーが内容を確認・検証できるようにという配慮です。作者に拍手を送りましょう!無料で利用できますが、コードの再公開はハウスルールに従う必要があります。
免責事項
この情報および投稿は、TradingViewが提供または推奨する金融、投資、トレード、その他のアドバイスや推奨を意図するものではなく、それらを構成するものでもありません。詳細は利用規約をご覧ください。