OPEN-SOURCE SCRIPT
更新済 S&D Direction
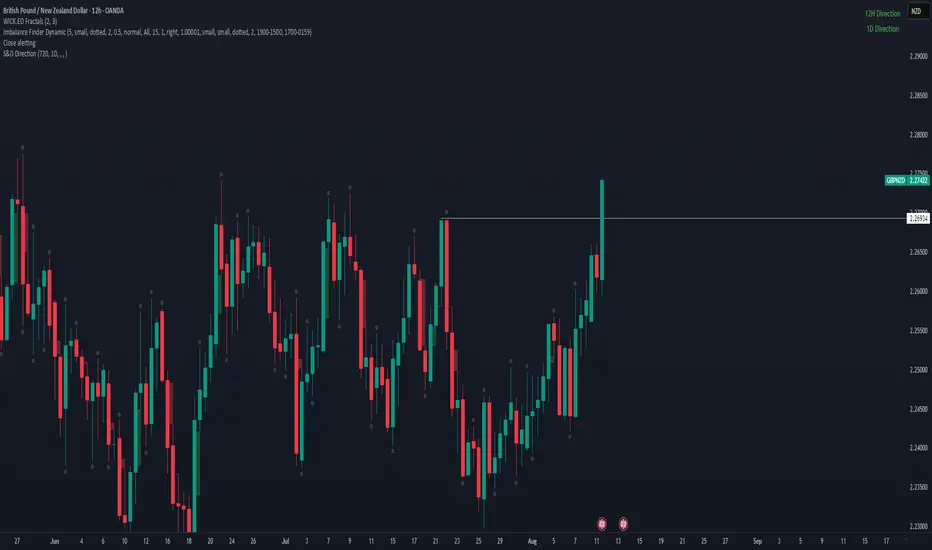
This indicator displays the most recent candle close direction for up to five custom timeframes, as selected in the settings. For each chosen timeframe, it shows whether the last confirmed candle close was bullish (close above the previous high) or bearish (close below the previous low). The indicator labels each timeframe in the top right corner, using green text for bullish closes and red for bearish closes. The displayed timeframes can be customized, and the direction (long/short) is clearly shown after each label.
リリースノート
This indicator displays the most recent candle close direction for up to five custom timeframes, as selected in the settings. For each chosen timeframe, it shows whether the last confirmed candle close was bullish (close above the previous high) or bearish (close below the previous low). The indicator labels each timeframe in the top right corner, using green text for bullish closes and red for bearish closes. The displayed timeframes can be customized, and the direction (long/short) is clearly shown after each label.リリースノート
bug fixedオープンソーススクリプト
In true TradingView spirit, the creator of this script has made it open-source, so that traders can review and verify its functionality. Kudos to the author! While you can use it for free, remember that republishing the code is subject to our House Rules.
免責事項
この情報および投稿は、TradingViewが提供または推奨する金融、投資、トレード、その他のアドバイスや推奨を意図するものではなく、それらを構成するものでもありません。詳細は利用規約をご覧ください。
オープンソーススクリプト
In true TradingView spirit, the creator of this script has made it open-source, so that traders can review and verify its functionality. Kudos to the author! While you can use it for free, remember that republishing the code is subject to our House Rules.
免責事項
この情報および投稿は、TradingViewが提供または推奨する金融、投資、トレード、その他のアドバイスや推奨を意図するものではなく、それらを構成するものでもありません。詳細は利用規約をご覧ください。