OPEN-SOURCE SCRIPT
Fisher Transform of On Balance Volume (by ChartArt)
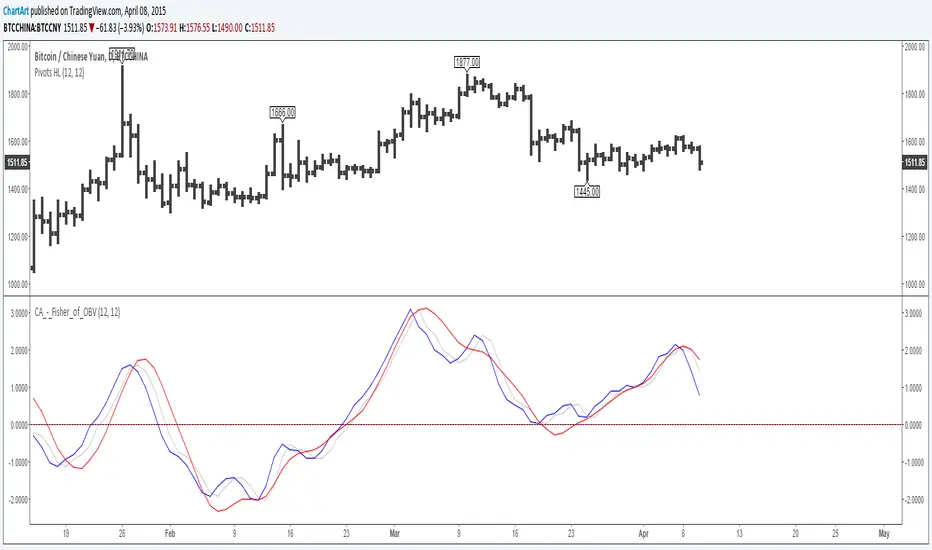
A simple mash-up of the On Balance Volume (OBV) indicator with the Fisher Transform indicator (blue) with the classic Fisher Transform signal trigger (silver color), plus a linear regression as a second signal line (red).
I recommend to use a period for the linear regression which has the same speed or is slower than the period of the Fisher Transform to avoid overshooting.
P.S. Here are three areas where the indicator worked quite good on historic charts


I recommend to use a period for the linear regression which has the same speed or is slower than the period of the Fisher Transform to avoid overshooting.
P.S. Here are three areas where the indicator worked quite good on historic charts
オープンソーススクリプト
TradingViewの精神に則り、このスクリプトの作者はコードをオープンソースとして公開してくれました。トレーダーが内容を確認・検証できるようにという配慮です。作者に拍手を送りましょう!無料で利用できますが、コードの再公開はハウスルールに従う必要があります。
免責事項
この情報および投稿は、TradingViewが提供または推奨する金融、投資、トレード、その他のアドバイスや推奨を意図するものではなく、それらを構成するものでもありません。詳細は利用規約をご覧ください。
オープンソーススクリプト
TradingViewの精神に則り、このスクリプトの作者はコードをオープンソースとして公開してくれました。トレーダーが内容を確認・検証できるようにという配慮です。作者に拍手を送りましょう!無料で利用できますが、コードの再公開はハウスルールに従う必要があります。
免責事項
この情報および投稿は、TradingViewが提供または推奨する金融、投資、トレード、その他のアドバイスや推奨を意図するものではなく、それらを構成するものでもありません。詳細は利用規約をご覧ください。