OPEN-SOURCE SCRIPT
Semi Deviation Point Percent
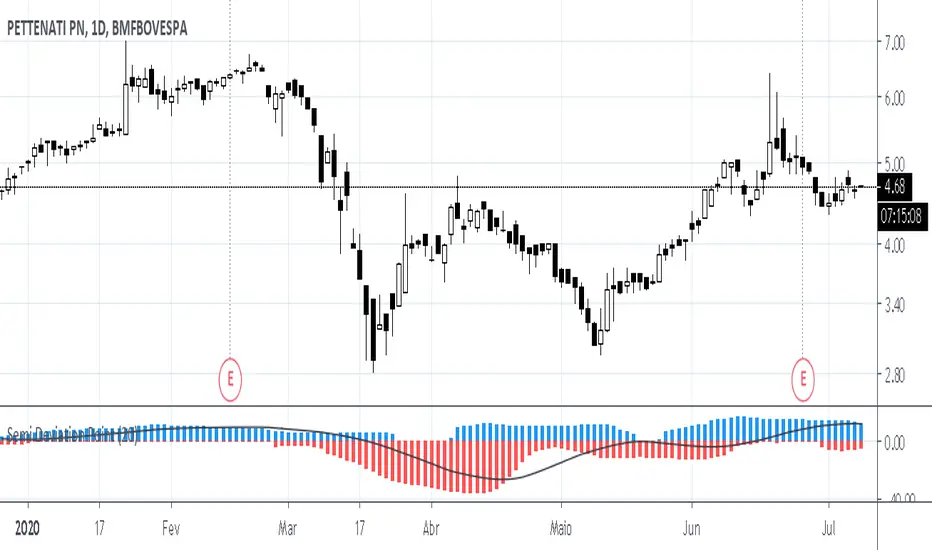
The Semi Deviation Point calculates the positive value as the standard deviation of only samples that has high value than the simple moving average. The negative value is the same standard deviation, but only uses the low value and multiply for -1.
After this calculate the value is divide by the value of simple moving average and multiplied by hundred to get a percent value from 0% to 100%.
The delta line is a simple moving average from the differences of the two values.
How it should be read?
If positive values are greater than negative values than the volatility is happen on higher prices and not lower.
If positive values are lower than negative values than the volatility is happen on lower prices and not higher.
If you know that in which market you would opt in? Is it less risk the prior?
オープンソーススクリプト
TradingViewの精神に則り、このスクリプトの作者はコードをオープンソースとして公開してくれました。トレーダーが内容を確認・検証できるようにという配慮です。作者に拍手を送りましょう!無料で利用できますが、コードの再公開はハウスルールに従う必要があります。
免責事項
この情報および投稿は、TradingViewが提供または推奨する金融、投資、トレード、その他のアドバイスや推奨を意図するものではなく、それらを構成するものでもありません。詳細は利用規約をご覧ください。
オープンソーススクリプト
TradingViewの精神に則り、このスクリプトの作者はコードをオープンソースとして公開してくれました。トレーダーが内容を確認・検証できるようにという配慮です。作者に拍手を送りましょう!無料で利用できますが、コードの再公開はハウスルールに従う必要があります。
免責事項
この情報および投稿は、TradingViewが提供または推奨する金融、投資、トレード、その他のアドバイスや推奨を意図するものではなく、それらを構成するものでもありません。詳細は利用規約をご覧ください。