OPEN-SOURCE SCRIPT
更新済 HVC Daily Levels
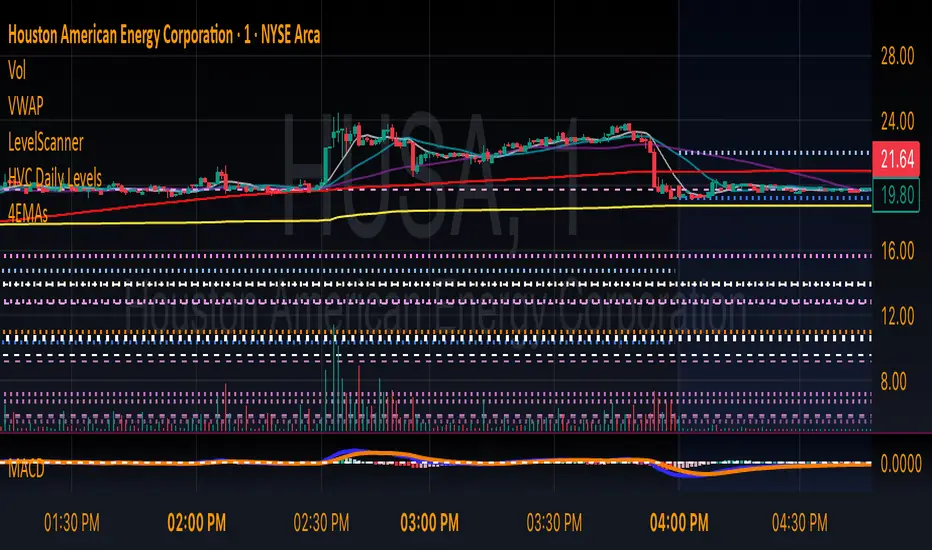
Daily High Volume Candle Levels Marked on all Timeframes
HVC Level Sentinel v6 — High Volume Candle Levels
HVC Level Sentinel v6 automatically detects and highlights “High Volume Candles” (HVCs) — bars with the highest trading volume in a rolling, user-defined window (e.g., 30 days). This tool helps you spot key price levels where significant trading activity occurred, which can act as important support or resistance zones.
Features
Customizable Lookback: Choose how many bars to look back for HVC detection (default: 30 days, adjustable).
Automatic Highlighting: HVC candles are highlighted on your chart with a customizable color.
Level Lines: Draws horizontal lines at the Open, High, Low, and Close of each recent HVC, so you can easily track these key levels.
Line Fading: Only the most recent N HVCs (user-adjustable) have lines, with older lines fading out or disappearing for clarity.
Per-Line Control: Turn on/off Open, High, Low, and Close lines individually in the settings.
Fully Customizable: Adjust colors, line styles, widths, and opacity to fit your chart style.
How It Works
On each new bar, the script checks if the current bar’s volume is the highest in the last N bars.
If so, it marks the bar as an HVC and draws lines at its O/H/L/C (if enabled).
You can highlight all HVCs historically, but only the most recent N will have lines for a clean, focused chart.
Use Cases
Identify major breakout or reversal points driven by high volume.
Track where institutional or “smart money” activity may have occurred.
Use HVC levels as dynamic support/resistance for entries, exits, or stop placement.
Tip:
Adjust the lookback window and number of HVCs with lines to match your trading style—shorter for active trading, longer for swing/position trading.
リリースノート
Daily High Volume Candle Levels Marked on all TimeframesHVC Level Sentinel v6 — High Volume Candle Levels
HVC Level Sentinel v6 automatically detects and highlights “High Volume Candles” (HVCs) — bars with the highest trading volume in a rolling, user-defined window (e.g., 30 days). This tool helps you spot key price levels where significant trading activity occurred, which can act as important support or resistance zones.
Features
Customizable Lookback: Choose how many bars to look back for HVC detection (default: 30 days, adjustable).
Automatic Highlighting: HVC candles are highlighted on your chart with a customizable color.
Level Lines: Draws horizontal lines at the Open, High, Low, and Close of each recent HVC, so you can easily track these key levels.
Line Fading: Only the most recent N HVCs (user-adjustable) have lines, with older lines fading out or disappearing for clarity.
Per-Line Control: Turn on/off Open, High, Low, and Close lines individually in the settings.
Fully Customizable: Adjust colors, line styles, widths, and opacity to fit your chart style.
How It Works
On each new bar, the script checks if the current bar’s volume is the highest in the last N bars.
If so, it marks the bar as an HVC and draws lines at its O/H/L/C (if enabled).
You can highlight all HVCs historically, but only the most recent N will have lines for a clean, focused chart.
Use Cases
Identify major breakout or reversal points driven by high volume.
Track where institutional or “smart money” activity may have occurred.
Use HVC levels as dynamic support/resistance for entries, exits, or stop placement.
Tip:
Adjust the lookback window and number of HVCs with lines to match your trading style—shorter for active trading, longer for swing/position trading.
オープンソーススクリプト
TradingViewの精神に則り、このスクリプトの作者はコードをオープンソースとして公開してくれました。トレーダーが内容を確認・検証できるようにという配慮です。作者に拍手を送りましょう!無料で利用できますが、コードの再公開はハウスルールに従う必要があります。
免責事項
この情報および投稿は、TradingViewが提供または推奨する金融、投資、トレード、その他のアドバイスや推奨を意図するものではなく、それらを構成するものでもありません。詳細は利用規約をご覧ください。
オープンソーススクリプト
TradingViewの精神に則り、このスクリプトの作者はコードをオープンソースとして公開してくれました。トレーダーが内容を確認・検証できるようにという配慮です。作者に拍手を送りましょう!無料で利用できますが、コードの再公開はハウスルールに従う必要があります。
免責事項
この情報および投稿は、TradingViewが提供または推奨する金融、投資、トレード、その他のアドバイスや推奨を意図するものではなく、それらを構成するものでもありません。詳細は利用規約をご覧ください。