OPEN-SOURCE SCRIPT
更新済 Multi-Timeframe Market Regime (Ehlers)
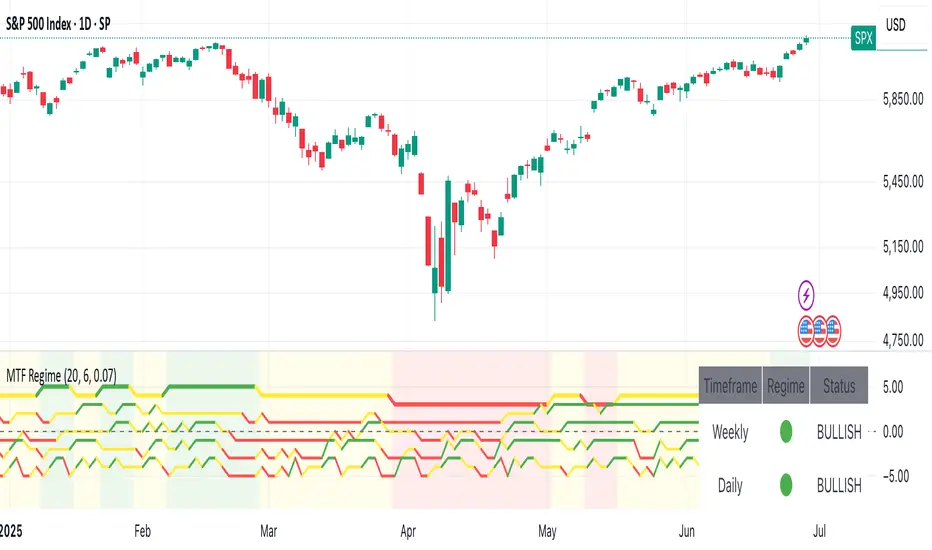
This Pine Script indicator provides an Ehlers-inspired multi-timeframe market regime analysis directly on your TradingView chart. It aims to identify whether the market is currently "Trending Up" (green), "Trending Down" (red), or "Ranging" (yellow) across Weekly, Daily, 4-Hour, and 1-Hour timeframes.
It uses custom implementations of:
Ehlers' Fisher Transform to highlight market extremes and potential turning points.
An Adaptive Moving Average (inspired by MAMA/FAMA) that adjusts its speed based on volatility to reduce lag in trends and provide stability in ranges.
The indicator displays a dashboard as a label on your chart, showing the detected regime for each of these timeframes, and optionally colors the background of your current chart timeframe to reflect its dominant regime.
リリースノート
Multi time frame market regime indicators based on John Ehlers work. It shows the directional bias across multiple time frames.オープンソーススクリプト
TradingViewの精神に則り、このスクリプトの作者はコードをオープンソースとして公開してくれました。トレーダーが内容を確認・検証できるようにという配慮です。作者に拍手を送りましょう!無料で利用できますが、コードの再公開はハウスルールに従う必要があります。
免責事項
この情報および投稿は、TradingViewが提供または推奨する金融、投資、トレード、その他のアドバイスや推奨を意図するものではなく、それらを構成するものでもありません。詳細は利用規約をご覧ください。
オープンソーススクリプト
TradingViewの精神に則り、このスクリプトの作者はコードをオープンソースとして公開してくれました。トレーダーが内容を確認・検証できるようにという配慮です。作者に拍手を送りましょう!無料で利用できますが、コードの再公開はハウスルールに従う必要があります。
免責事項
この情報および投稿は、TradingViewが提供または推奨する金融、投資、トレード、その他のアドバイスや推奨を意図するものではなく、それらを構成するものでもありません。詳細は利用規約をご覧ください。