OPEN-SOURCE SCRIPT
更新済 Simple Auto Swing Lines
# Simple Auto Swing Lines
## What It Does
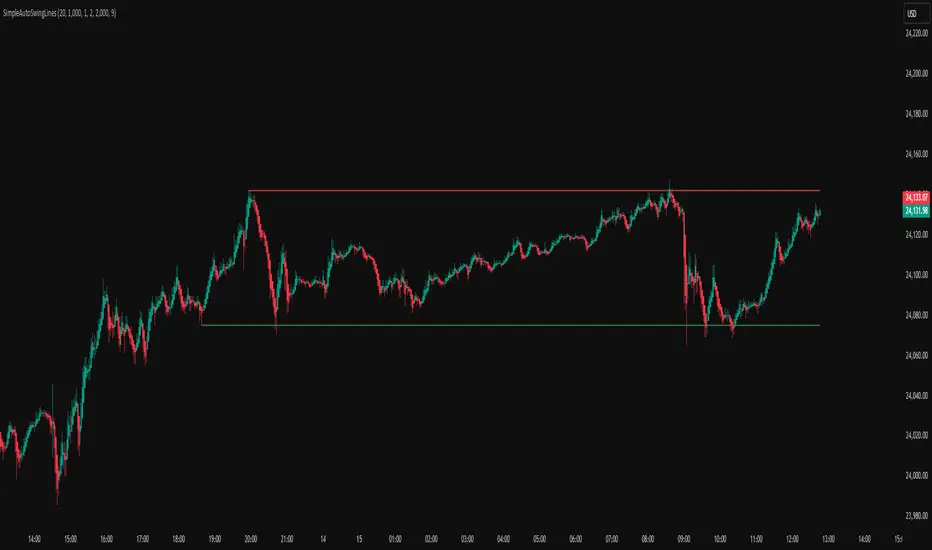
This indicator automatically draws horizontal support and resistance lines based on swing highs and lows with line management and touch-based alerts.
## How It Works
**Swing Detection:**
- Uses pivot point analysis to identify significant highs and lows
- Configurable pivot strength determines sensitivity (higher = more significant swings)
- Draws horizontal lines from these swing points extending to current price
**Line Management:**
- Proximity Filter: Removes lines that are too close together to prevent clutter
- Auto-Hide Feature: Lines disappear after price closes beyond them for a set number of candles
- Permanent Clipping: Once a line is crossed for the threshold period, it stays hidden
- Dynamic Updates: Only shows the most relevant recent swing levels
**Touch-Based Alert System:**
- "Swing High touched" - Alerts when price touches resistance lines from any direction
- "Swing Low touched" - Alerts when price touches support lines from any direction
- "Any Swing Level touched" - Combined alert for any swing line interaction
## Key Settings
**Pivot Detection:**
- Pivot Strength (50): Higher values = fewer, more significant swing lines
- Max Lookback Bars (1000): How far back to look for swing points
**Line Appearance:**
- Max Lines (5): Maximum number of swing lines per side (total lines = 2x this number)
- Line Thickness (1-5): Customize line width
- Resistance/Support Colors: Red for highs, green for lows
- Show Labels: Optional swing high/low labels (default: off)
**Display Controls:**
- Proximity Filter (2000 ticks): Minimum distance between lines to prevent clutter
- Candles Before Hide (7): How many consecutive closes beyond a line before permanent removal
## What It Does
This indicator automatically draws horizontal support and resistance lines based on swing highs and lows with line management and touch-based alerts.
## How It Works
**Swing Detection:**
- Uses pivot point analysis to identify significant highs and lows
- Configurable pivot strength determines sensitivity (higher = more significant swings)
- Draws horizontal lines from these swing points extending to current price
**Line Management:**
- Proximity Filter: Removes lines that are too close together to prevent clutter
- Auto-Hide Feature: Lines disappear after price closes beyond them for a set number of candles
- Permanent Clipping: Once a line is crossed for the threshold period, it stays hidden
- Dynamic Updates: Only shows the most relevant recent swing levels
**Touch-Based Alert System:**
- "Swing High touched" - Alerts when price touches resistance lines from any direction
- "Swing Low touched" - Alerts when price touches support lines from any direction
- "Any Swing Level touched" - Combined alert for any swing line interaction
## Key Settings
**Pivot Detection:**
- Pivot Strength (50): Higher values = fewer, more significant swing lines
- Max Lookback Bars (1000): How far back to look for swing points
**Line Appearance:**
- Max Lines (5): Maximum number of swing lines per side (total lines = 2x this number)
- Line Thickness (1-5): Customize line width
- Resistance/Support Colors: Red for highs, green for lows
- Show Labels: Optional swing high/low labels (default: off)
**Display Controls:**
- Proximity Filter (2000 ticks): Minimum distance between lines to prevent clutter
- Candles Before Hide (7): How many consecutive closes beyond a line before permanent removal
リリースノート
Updated chart example to include both support and resistance lines. リリースノート
Fix: sometimes alerts were going off when swing level wasn't touched. This should not happen anymore. リリースノート
Add: 'Extend Left' and 'Extend Right' settings for displayed lines オープンソーススクリプト
TradingViewの精神に則り、このスクリプトの作者はコードをオープンソースとして公開してくれました。トレーダーが内容を確認・検証できるようにという配慮です。作者に拍手を送りましょう!無料で利用できますが、コードの再公開はハウスルールに従う必要があります。
免責事項
この情報および投稿は、TradingViewが提供または推奨する金融、投資、トレード、その他のアドバイスや推奨を意図するものではなく、それらを構成するものでもありません。詳細は利用規約をご覧ください。
オープンソーススクリプト
TradingViewの精神に則り、このスクリプトの作者はコードをオープンソースとして公開してくれました。トレーダーが内容を確認・検証できるようにという配慮です。作者に拍手を送りましょう!無料で利用できますが、コードの再公開はハウスルールに従う必要があります。
免責事項
この情報および投稿は、TradingViewが提供または推奨する金融、投資、トレード、その他のアドバイスや推奨を意図するものではなく、それらを構成するものでもありません。詳細は利用規約をご覧ください。