PINE LIBRARY
更新済 arraybrowser
█ ARRAY BROWSER
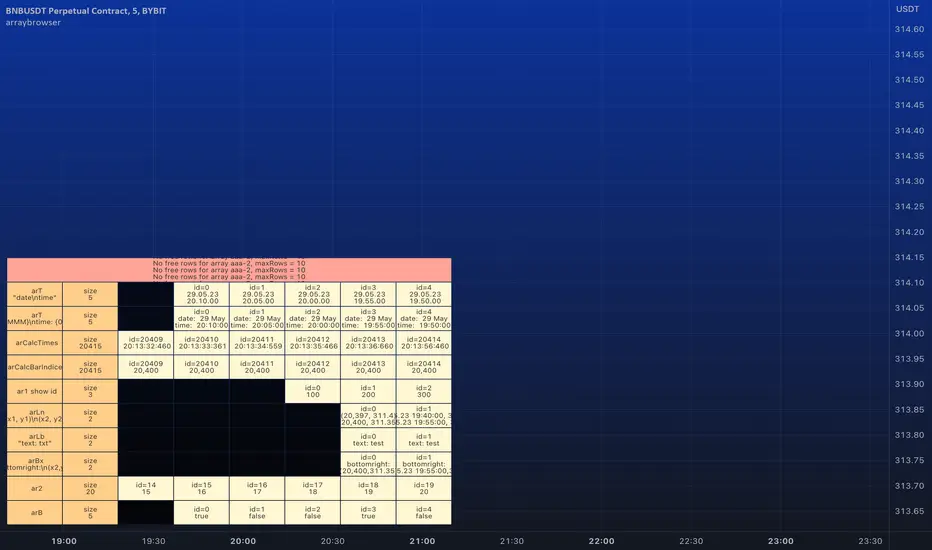
Add you arrays to the array browser window and scroll them away left and right.
Flexible formatting options (see below).
Many thanks to kaigouthro for his beautiful matrixautotable library. (import kaigouthro/matrixautotable/14)
How to use
Copy the "ARRAY BROWSER" commented code section below to your script and uncomment.
See DEMO section in the library for usage examples.
Basically: add() your arrays and draw() on barstate.islast.
If your script adds the arrays every calculation do not forget to clear() before adding.
Otherwise, since the arrays are added by reference, no need to add them on every bar, every time you draw() the actual values are retrieved.
Up to 10 arrays of each type (float/string/line/label/box) are supported (total 50 arrays).
Change offset in the input settings to scroll left/right.
Usage example:
Pine Script®
Formatting options
For float/int you can always use format string like "{0, time, HH:mm:ss}" or "{0.00}".
Additional options are
- --- Number formats ---
- "number"
- "0"
- "0.0"
- "0.00"
- "0.000"
- "0.0000"
- "0.00000"
- "0.000000"
- "0.0000000"
- --- Date formats ---
- "date"
- "date : time"
- "dd.MM"
- "dd"
- --- Time formats ---
- "time"
- "HH:mm"
- "mm:ss"
- "date time"
- "date, time"
- "date,time"
- "date\time"
For line and box: Empty `format` returns coordinates as "(x1, y1) - (x2, y2)". Otherwise "x1", "x2", "y1", "y2" in `format` string are replaced by values. (e.g. toS(line, "x1, x2") will only return x1 and x2 separated by comma).
For label: Empty `format` returns coordinates and text as "(x, y): text = text". Otherwise "x1", "y1", "txt" in `format` string are replaced by values. (e.g. toS(label, "txt") will only return text of the label)
Add you arrays to the array browser window and scroll them away left and right.
Flexible formatting options (see below).
Many thanks to kaigouthro for his beautiful matrixautotable library. (import kaigouthro/matrixautotable/14)
How to use
Copy the "ARRAY BROWSER" commented code section below to your script and uncomment.
See DEMO section in the library for usage examples.
Basically: add() your arrays and draw() on barstate.islast.
If your script adds the arrays every calculation do not forget to clear() before adding.
Otherwise, since the arrays are added by reference, no need to add them on every bar, every time you draw() the actual values are retrieved.
Up to 10 arrays of each type (float/string/line/label/box) are supported (total 50 arrays).
Change offset in the input settings to scroll left/right.
Usage example:
import moebius1977/arraybrowser/1 as arraybrowser // this alias is used in the copied section, so better keep it
[...]
<COPIED "ARRAY BROWSER" SECTION>
[...]
arbr.clear() // clears all rows and deletes the table
arbr.add(arrayFloat, format = "0.00") // adds an array with title
arbr.add(arrayInt) // adds an array without title
arbr.add(arrayTimes, "array of times 1", "date\ntime") // format date and time so as to fit in the cell.
arbr.add(arrayTimes, "array of times 2", "{0, time, HH:mm}") // format date and time so as to fit in the cell.
arbr.add(arrayString) //
arbr.add(arrayLine, "arrayLines", "(x1, y1)\n(x2,y2)") // use your own format combining "x1", "y1", "x2", "y2"
arbr.add(arrayLabel, "arrayLabel", "txt") // only print label text, no coordinates
arbr.add(arrayBox, showIds = true) // show ID's for this array if input setting is "individually"
arbr.draw() // shows the table with arrays, use on barstate.islast
Formatting options
For float/int you can always use format string like "{0, time, HH:mm:ss}" or "{0.00}".
Additional options are
- --- Number formats ---
- "number"
- "0"
- "0.0"
- "0.00"
- "0.000"
- "0.0000"
- "0.00000"
- "0.000000"
- "0.0000000"
- --- Date formats ---
- "date"
- "date : time"
- "dd.MM"
- "dd"
- --- Time formats ---
- "time"
- "HH:mm"
- "mm:ss"
- "date time"
- "date, time"
- "date,time"
- "date\time"
For line and box: Empty `format` returns coordinates as "(x1, y1) - (x2, y2)". Otherwise "x1", "x2", "y1", "y2" in `format` string are replaced by values. (e.g. toS(line, "x1, x2") will only return x1 and x2 separated by comma).
For label: Empty `format` returns coordinates and text as "(x, y): text = text". Otherwise "x1", "y1", "txt" in `format` string are replaced by values. (e.g. toS(label, "txt") will only return text of the label)
リリースノート
v2 Added support for bool arrays. Changing text color does not work temporarily.
リリースノート
v3 A minor bug fix. (in deleteRow())リリースノート
v4 Same amendment as above.リリースノート
v5 Added support for varip arrays. Previous versions disrupted behaviour of varip arrays.Pineライブラリ
TradingViewの精神に則り、作者はこのPineコードをオープンソースライブラリとして公開してくれました。コミュニティの他のPineプログラマーが再利用できるようにという配慮です。作者に拍手を!このライブラリは個人利用や他のオープンソースの公開コンテンツで使用できますが、公開物でのコードの再利用はハウスルールに準じる必要があります。
免責事項
この情報および投稿は、TradingViewが提供または推奨する金融、投資、トレード、その他のアドバイスや推奨を意図するものではなく、それらを構成するものでもありません。詳細は利用規約をご覧ください。
Pineライブラリ
TradingViewの精神に則り、作者はこのPineコードをオープンソースライブラリとして公開してくれました。コミュニティの他のPineプログラマーが再利用できるようにという配慮です。作者に拍手を!このライブラリは個人利用や他のオープンソースの公開コンテンツで使用できますが、公開物でのコードの再利用はハウスルールに準じる必要があります。
免責事項
この情報および投稿は、TradingViewが提供または推奨する金融、投資、トレード、その他のアドバイスや推奨を意図するものではなく、それらを構成するものでもありません。詳細は利用規約をご覧ください。