OPEN-SOURCE SCRIPT
Supply Demand by WowTradingInfo
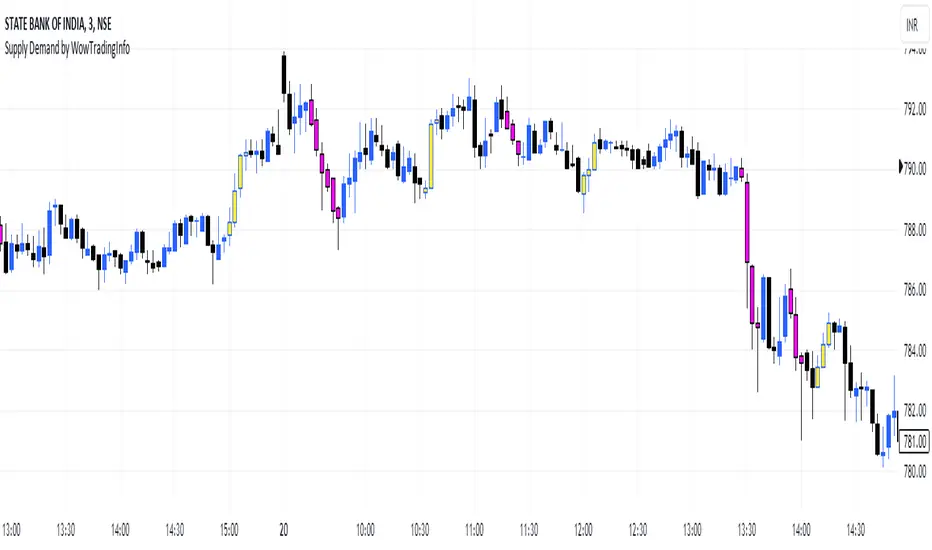
This indicator identifies supply and demand zones based on price action, which is a crucial concept for technical analysis. Supply zones represent areas where the price has historically shown selling pressure, while demand zones show areas with strong buying interest.
Explanation:
Rally-Base-Rally (RBR):
A rally is defined as a price movement where the percentage increase between the current high and the previous low.
A base is defined as a period of consolidation where price stays within a narrow range, with low volatility.
A RBR pattern is detected when a rally occurs, followed by a base, and then another rally.
Drop-Base-Drop (DBD):
A drop is identified when the price decrease between the current low and the previous high.
A DBD pattern is detected when a drop occurs, followed by a base, and then another drop.
Zone Marking:
RBR Zones are drawn with repaint the candles color as yellow (where buyers are likely to step in).
DBD Zones are drawn with repaint the candles color as pink (where sellers are likely to step in).
Example Use Case:
Rally-Base-Rally: When you see a yellow zone, it suggests that price rallied, consolidated, and is likely to rally again. It can be used as a potential demand zone.
Drop-Base-Drop: pink zones indicate that price dropped, consolidated, and may drop again. It can be used as a potential supply zone.
This script will help you automatically detect and visualize RBR and DBD patterns on your TradingView chart. These zones can provide valuable insights into areas where price may react due to past buying or selling pressure.
オープンソーススクリプト
TradingViewの精神に則り、このスクリプトの作者はコードをオープンソースとして公開してくれました。トレーダーが内容を確認・検証できるようにという配慮です。作者に拍手を送りましょう!無料で利用できますが、コードの再公開はハウスルールに従う必要があります。
免責事項
この情報および投稿は、TradingViewが提供または推奨する金融、投資、トレード、その他のアドバイスや推奨を意図するものではなく、それらを構成するものでもありません。詳細は利用規約をご覧ください。
オープンソーススクリプト
TradingViewの精神に則り、このスクリプトの作者はコードをオープンソースとして公開してくれました。トレーダーが内容を確認・検証できるようにという配慮です。作者に拍手を送りましょう!無料で利用できますが、コードの再公開はハウスルールに従う必要があります。
免責事項
この情報および投稿は、TradingViewが提供または推奨する金融、投資、トレード、その他のアドバイスや推奨を意図するものではなく、それらを構成するものでもありません。詳細は利用規約をご覧ください。