OPEN-SOURCE SCRIPT
Optimized MTF Indicator
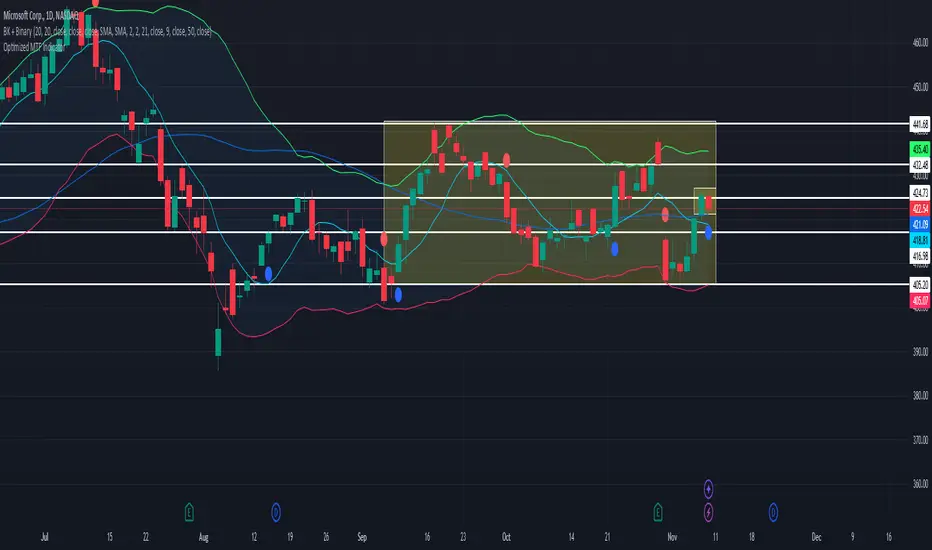
This Pine Script is a custom Multi-Timeframe (MTF) indicator that dynamically adjusts its analysis based on the current chart's timeframe. It calculates MACD crossovers for two different timeframes (a lower and a higher timeframe) and plots visual signals (colored circles) on the chart to indicate the crossovers. This can help traders make more informed decisions by providing insights from multiple timeframes.
The steps are as follows:
The current chart's timeframe is used to dynamically set corresponding lower and higher timeframes.
MACD analysis (with crossovers) is performed for both the lower and higher timeframes.
Visual signals (colored circles) are plotted to indicate the MACD crossovers on both timeframes, helping traders spot potential buy (bullish) or sell (bearish) signals.
オープンソーススクリプト
TradingViewの精神に則り、このスクリプトの作者はコードをオープンソースとして公開してくれました。トレーダーが内容を確認・検証できるようにという配慮です。作者に拍手を送りましょう!無料で利用できますが、コードの再公開はハウスルールに従う必要があります。
免責事項
この情報および投稿は、TradingViewが提供または推奨する金融、投資、トレード、その他のアドバイスや推奨を意図するものではなく、それらを構成するものでもありません。詳細は利用規約をご覧ください。
オープンソーススクリプト
TradingViewの精神に則り、このスクリプトの作者はコードをオープンソースとして公開してくれました。トレーダーが内容を確認・検証できるようにという配慮です。作者に拍手を送りましょう!無料で利用できますが、コードの再公開はハウスルールに従う必要があります。
免責事項
この情報および投稿は、TradingViewが提供または推奨する金融、投資、トレード、その他のアドバイスや推奨を意図するものではなく、それらを構成するものでもありません。詳細は利用規約をご覧ください。